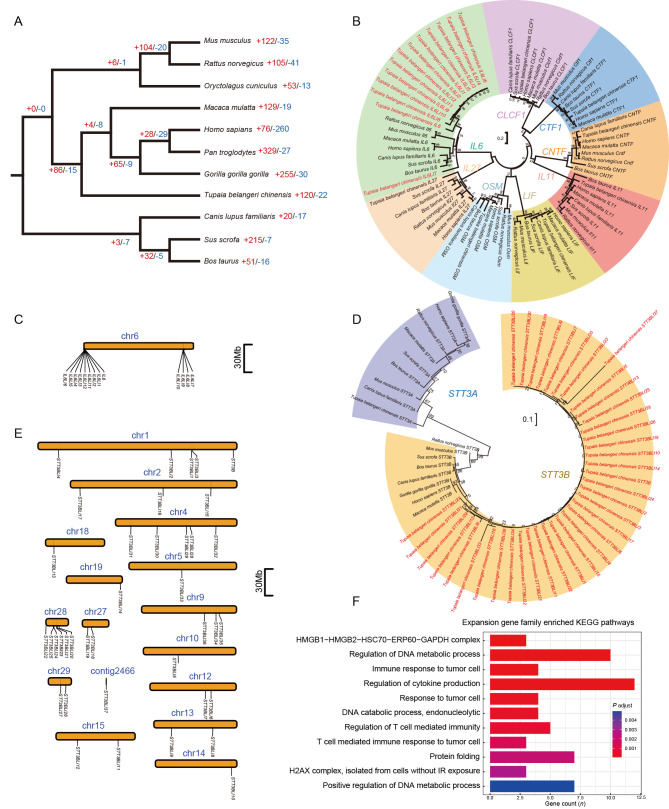
Figure 4.
Orthologous relationships and gene family size changes among different species
A: Phylogenetic tree of 11 mammals using orthogroups. Numbers on tree branches refer to numbers of gene family expansion (+red) and contraction (-blue), respectively. B: Maximum-likelihood (ML) trees of IL6 gene family. Coding sequence of the longest transcript for each gene in each species was used to construct ML tree. Values on tree branches refer to support of 1 000 bootstraps. The tree shrewIL6 gene family had 13 copies, labeled in red in the tree. C: Locations of 13 tree shrew IL6 gene copies on pseudochromosome 6 (chr6). D: ML trees of STT3B gene family and STT3A. Tree shrew STT3B gene family had 39 copies. E: Locations of 39 tree shrew STT3B gene copies on 15 pseudochromosomes and one unplaced contig. Pseudochromosomes and unplaced contig were defined in reference tree shrew genome TS_2.0 (Fan et al., 2019). F: Pathway enrichment of genes from tree shrew-specific gene families with significant expansion.

