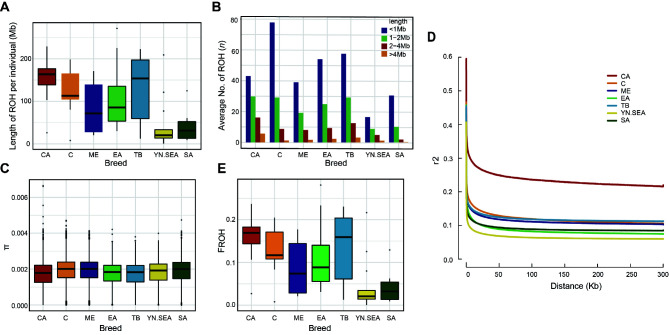
Figure 2.
Analysis of genomic variation, LD, and FROH for CA chickens
Length (A) and average number (B) of ROHs in CA chickens and other representative chickens of worldwide geographical distribution. C: Distributions of π in different groups. D: Decay of LD in different groups, with one line per breed. E: FROH in different chicken groups.

