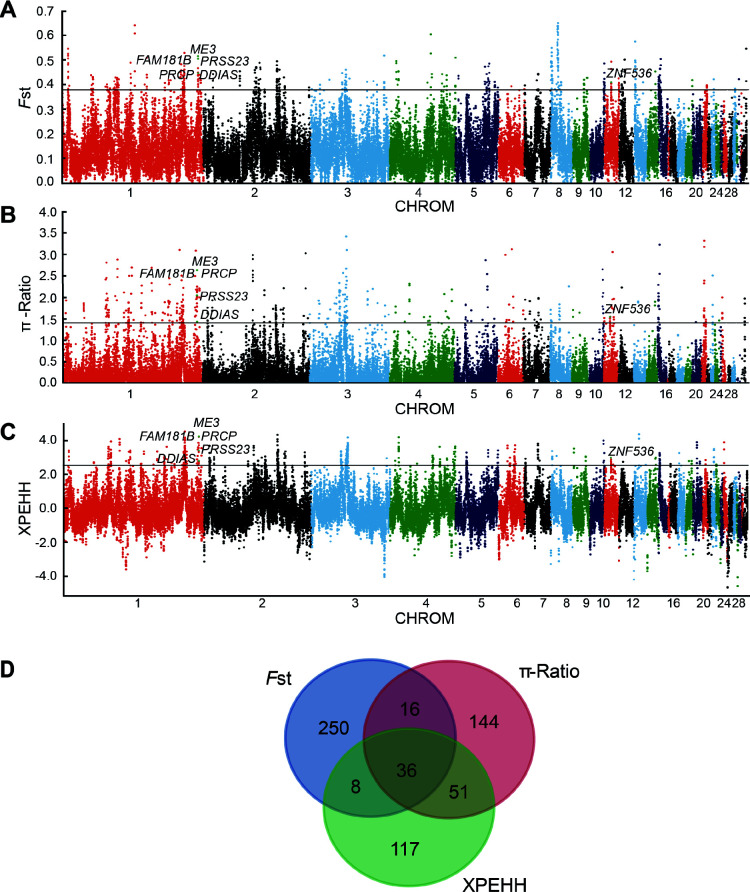
Figure 3.
Genome-wide selection scan for PSGs in CA chickens using sliding window analysis (40 kb window size, 20 kb step size, kb increment, 99th percentile cutoff)
A: Selection signatures in CA chickens for FstCA-to-ME. B: Selection signatures in CA chickens for π-RatioME/CA. C: Selection signatures in CA chickens for XPEHHCA-to-ME. Threshold (top 1%) of FstCA-to-ME, π-RatioME/CA, and XPEHHCA-to-ME is marked with a horizontal black line. D: Number of PSGs identified in CA chickens by the three methods listed in each Venn diagram component.

