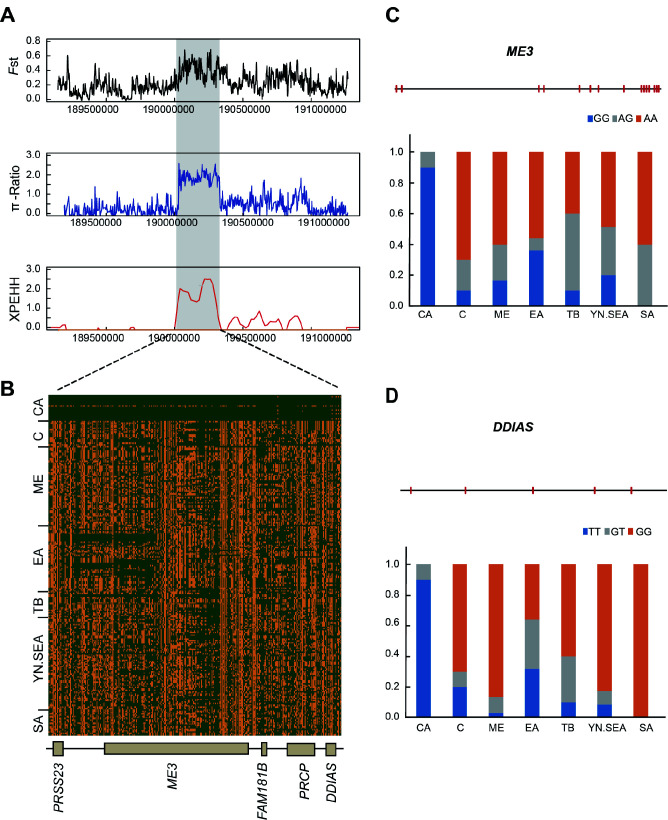
Figure 4.
Selection signals in 250 kb region of chromosome 1 in CA chickens
A: Zoom of selective analyses in 250 kb region of chromosome 1. FstCA-to-ME, π-RatioME/CA, and XPEHHCA-to-ME were plotted as lines based on sliding window analysis (4 kb window and 2 kb increment). B: Degree of haplotype sharing between CA and other chickens in 250 kb region of chromosome 1, which contained five genes. Structure diagram of ME3 (C) and DDIAS (D) genes, with red bars representing exons, and allele frequency of mutant ME3 and DDIAS loci. Blue, gray, and orange represent homozygous mutant, heterozygous mutant, and homozygous wild-type, respectively.

