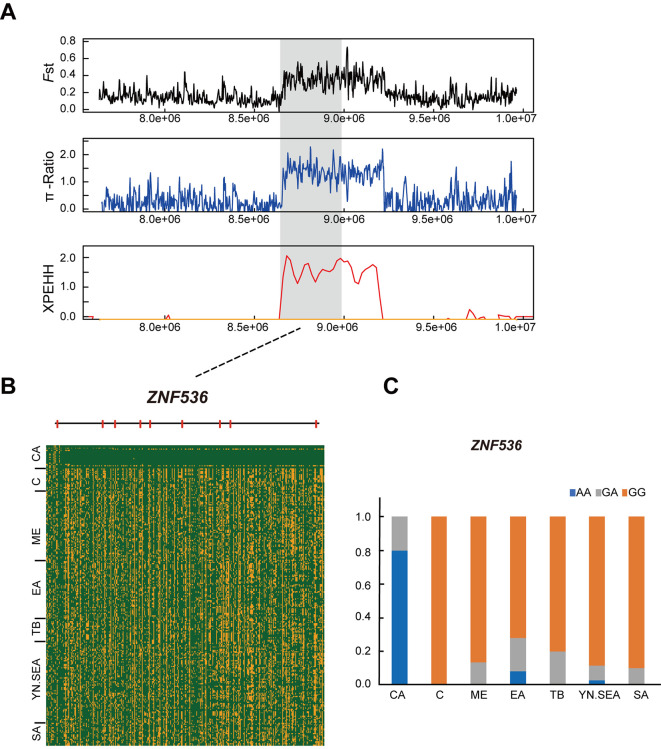
Figure 5.
Selective signature on ZNF536 in CA chickens
A: Zoom of selective analyses in ZNF536 region. FstCA-to-ME, π-RatioME/CA, and XPEHHCA-to-ME were plotted as lines based on sliding window analysis (4 kb window and 2 kb increment). B: Structure diagram ofZNF536 gene, with red bars representing exons, and degree of haplotype sharing between CA and other chickens in ZNF536 gene. C: Allele frequency of mutant ZNF536 loci. Blue, gray, and orange represent homozygous mutant, heterozygous mutant, and homozygous wild-type, respectively.

