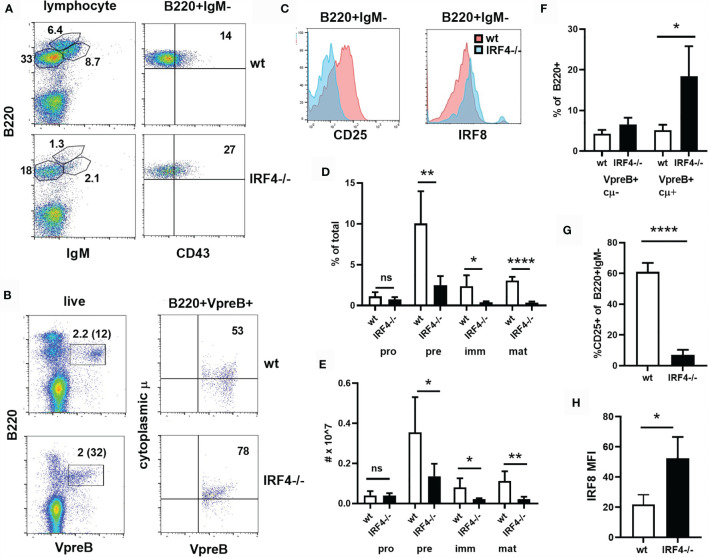
Figure 1.
Partial block beyond the preBCR+CD25- stage of B cell development in IRF4-deficient bone marrow. (A) Bone marrow was stained with antibodies against B220, IgM and CD43. The gate used is shown above the plots, and the frequency of cells in the relevant gates is indicated. (B) Bone marrow was stained extracellularly with anti-B220 and intracellularly with anti-VpreB and anti-IgM heavy chain (cytoplasmic μ or cμ). The gate used is shown above the plots. The frequency of cells in the relevant gates is indicated [on the left plot as a percentage of total and of B220+ (in parentheses)]. (C) Bone marrow was stained with antibodies against B220, IgM, and CD25 or intracellular IRF8. CD25 and IRF8 histograms are shown for B220+IgM- cells. Red = wt, blue = IRF4-deficient. (D, E) The frequency (D) and total number (E) of pro-B (B220+IgM-CD43+), pre-B (B220+IgM-CD43-), immature B (B220medIgM+), mature B (B220hi) cells in the bone marrow of wt (open bars) and IRF4-deficient (filled bars) mice, gated as in (A). Data represent mean +/- SD, n= 5. ns, not significant; *p < 0.05, **p < 0.01, ****p < 0.0001 by Student’s t-test. (F) The frequency of VpreB+cμ- and VpreB+cμ+ cells among B220+ cells is indicated, gated as in (B). Data represent mean +/- SD, n = 4. *p < 0.05 by Student’s t-test. (G) The frequency of CD25+ cells among B220+IgM- cells is shown. Data represent mean +/- SD, n = 6. ****p < 0.0001 by Student’s t-test. (H) IRF8 gMFI in B220+IgM- cells is shown. Data represent mean +/- SD, n = 3. *p < 0.05 by Student’s t-test.

