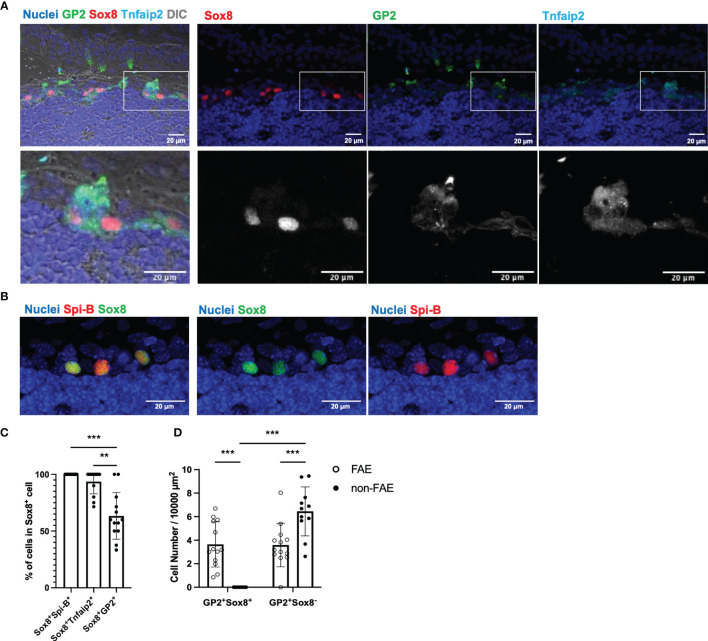
Figure 2.
Confocal microscope images of TALT FAE. (A) Multicolor immunofluorescence images of GP2 (green), Sox8 (red), and Tnfaip2 (cyan) were shown. Lower panels are higher magnification images of the area illustrated at the upper panel. Each channel is shown separately in each color with nuclei (upper panel) and in grayscale (lower panel). DIC, differential interference contrast. (B) Fixed cryosections, including TALT, were heated in Tris-HCl buffer with EDTA solutions (pH 9.0) before immunostaining of Spi-B for retrieving antigens. Spi-B (red) Sox8 (green) double-positive cells are found in TALT FAE. Nuclei were stained with Hoechst 33342 (blue). Bars: 20 µm. Representative images of those obtained from at least 3 animals are shown. Images were acquired by confocal microscopy. (C) Quantification of Sox8+ Spi-B+, Sox8+ Tnfaip2+ and Sox8+ GP2+ cells in Sox8+ cells of TALT FAE. Individual symbols represent the frequency of each cell population in a cryosection. Bars represent the mean ± standard deviation. ***P < 0.001, **P < 0.01 (Kruskal-Wallis test, n = 5 animals). (D) The number of GP2+ Sox8+ or GP2+ Sox8- cells in FAE or non-FAE were measured. Bars represent the mean ± standard deviation. ***P < 0.001 (two-way ANOVA test, n = 5 animals).

