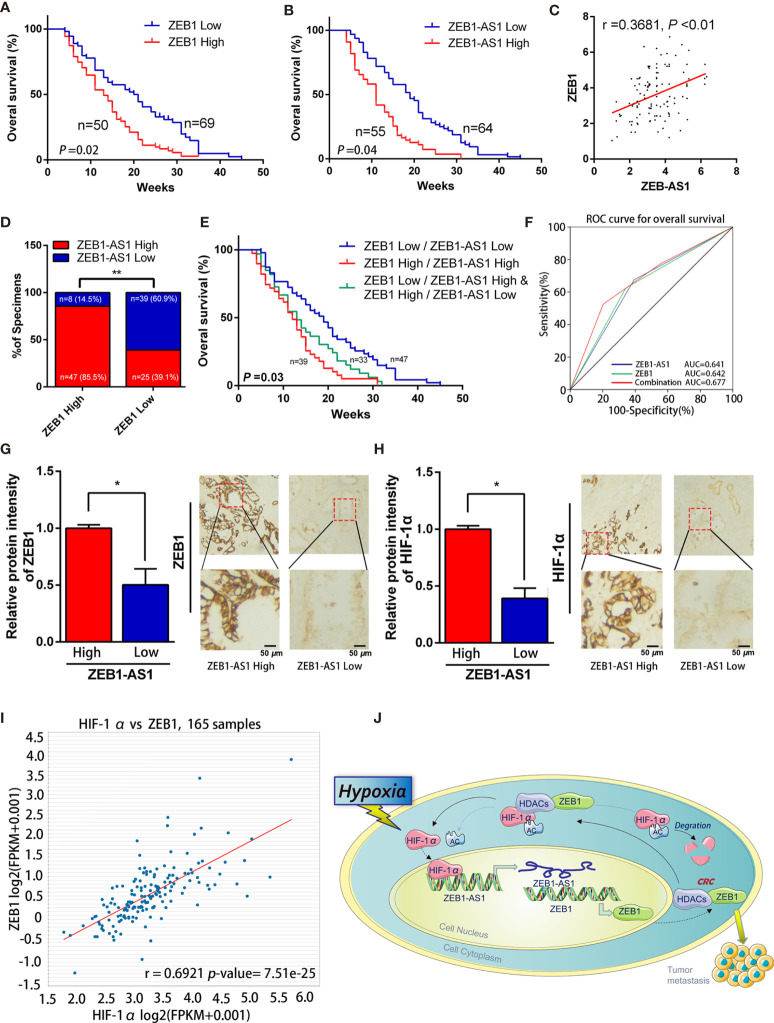
Figure 7.
ZEB1-AS1 was upregulated in PC and correlates with poor clinical outcome. (A) Overall survival of 119 patients with PC was analyzed by generation of Kaplan-Meier curves. The low or high ZEB1 groups are below or above the 50th percentile of ZEB1 expression, respectively. (B) Overall survival of 119 patients with PC was analyzed by generation of Kaplan-Meier curves. The low or high ZEB1-AS1 groups are below or above the 50th percentile of ZEB1-AS1 expression, respectively. (C) Pearson’s correlation analysis was applied to confirm the relationship of the expression between ZEB1-AS1 and ZEB1 in 119 patients with PC. (D) Correlation between ZEB1-AS1 and ZEB1 in specimens of patients with PC were analyzed by Chi-square test. (E) Kaplan-Meier analysis of overall survival for patients with 119 PC patients based on the number of upregulated molecular markers including ZEB1-AS1 and ZEB1. Patients were divided into three groups based on the expression of ZEB1-AS1 and ZEB1 at RNA levels. (F) ROC curve analysis for overall survival for ZEB1-AS1 (AUC = 0.641 (95% CI, 0.536–0.746), p = 0.012), ZEB1 (AUC = 0.642 (95% CI, 0.536–0.748), p = 0.012) as individual biomarkers or for the combined panel (AUC = 0.677 (95% CI, 0.572–0.781), p = 0.002). Area under the curve (AUC) was measured to assess predictive capability; 95% CI, 95% confidence interval. (G, H) ZEB1 and HIF-1α expression in high or low levels of ZEB1-AS1 from tissues of PC patients analyzed by IHC. Histogram showed the relative protein intensity via IHC scores (left). Representative images of stained sections were confirmed (right). (I) Correlation of ZEB1 and HIF-1α RNA expression was analyzed from the TCGA pancreatic cancer dataset through applying online database ChIPBase. (J) A graphical representation of the proposed mechanisms, hypoxia induced ZEB1-AS1 expression which promotes ZEB1 upregulation and then further cause malignant progression of PC cells.

