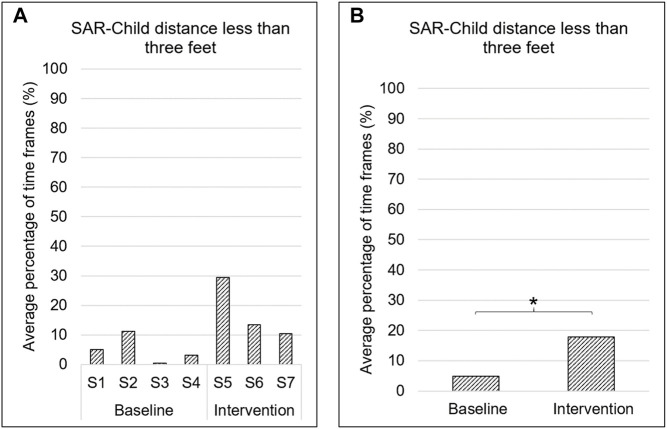
FIGURE 5.
SAR-child positioning. A. Average percentage of time frames when children were within three feet of the robot. S# on the x-axis represents the session number. B. Average percentage of time frames when children were within three feet of the robot during baseline and intervention phases. * → p < 0.05.

