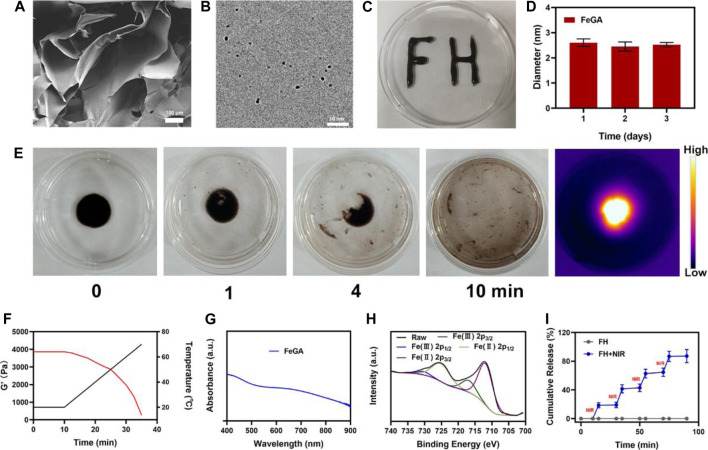
FIGURE 1.
(A) SEM image of hydrogel. (B) TEM image of FeGA. (C) Written using the prepared FH via syringe, demonstrating the stability of this compound. (D) Statistical graph of measured diameter size of FeGA. (E) The morphology of the prepared FH before and after 0.5 W/cm2 808 nm laser irradiation for 10 min and infrared thermal images of the prepared FH following irradiation. (F) Rheological and temperature curves (red and black, respectively) for the prepared FH under conditions that simulate an exposure to 0.5 W/cm2 808 nm laser irradiation. (G) FeGA absorbance spectra. (H) XPS spectra of Fe 2p orbit in FeGA. (I) In vitro FeGA release profile in the presence and absence of 808 nm laser irradiation, with NIR being used to indicate irradiation time points.

