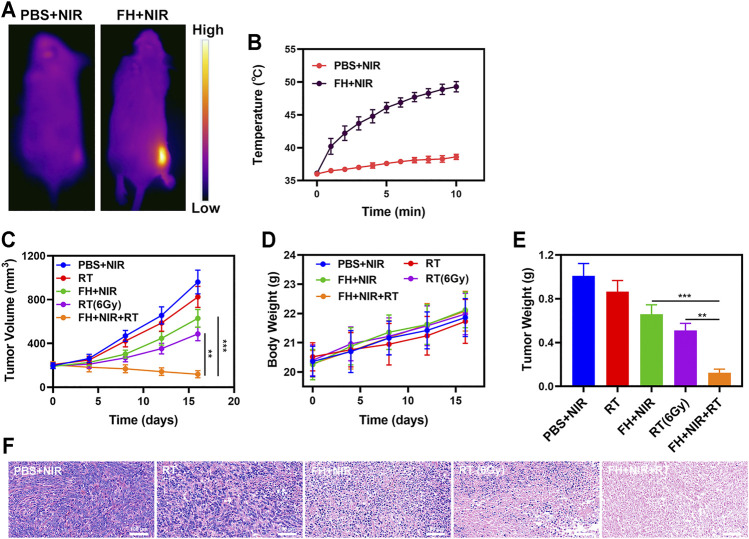
FIGURE 3.
(A) IR thermal images of tumors following an 808 nm laser irradiation (0.5 W/cm2) for 5 min in the indicated treatment groups. (B) Temperature increases in mice implanted with 4T1 tumors following 808 nm laser irradiation (0.5 W/cm2) for 5 min in the indicated treatment groups. (C) Tumor volume change over time in groups treated as indicated. (D) Changes in body weight in response to the indicated treatments. (E) Average tumor weight values associated with the indicated treatments. (F) H and E stained tumor sections from the indicated treatment groups. **p < 0.01, ***p < 0.005; Student’s t-test.

