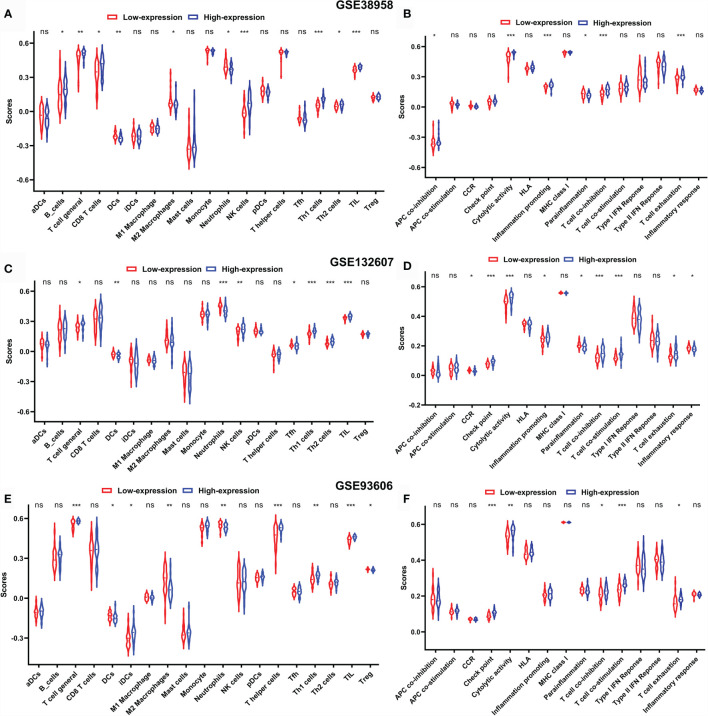
Figure 8.
Comparison of the ssGSEA scores between patients with low-expression CD247 and patients with high-expression CD247 in the GSE38958 dataset (A, B), GSE132607 dataset (C, D), and GSE93606 dataset (E, F). The scores of 19 immune cells (A, C, E) and 15 immune-related functions (B, D, F) are displayed in violin plots. DC, dendritic cell; TIL, tumor-infiltrating lymphocytes; CCR, cytokine–cytokine receptor. P values were shown as: ns, not significant; *p < 0.05; **p < 0.01; ***p < 0.001.

