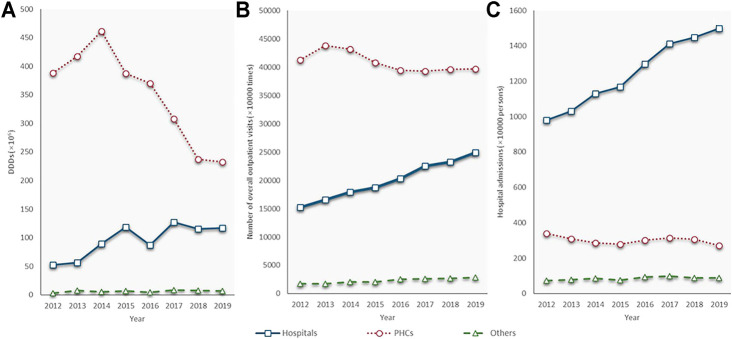
FIGURE 3.
Antibiotic consumption and quantity of health service utilization by types of health care institutions, 2012–19. (A) Antibiotic consumption; (B) Number of outpatient visits; (C) Number of admissions; PHC: primary health care centre; Source of (A) and (B): Shandong bulletin of health development, 2013–2020.

