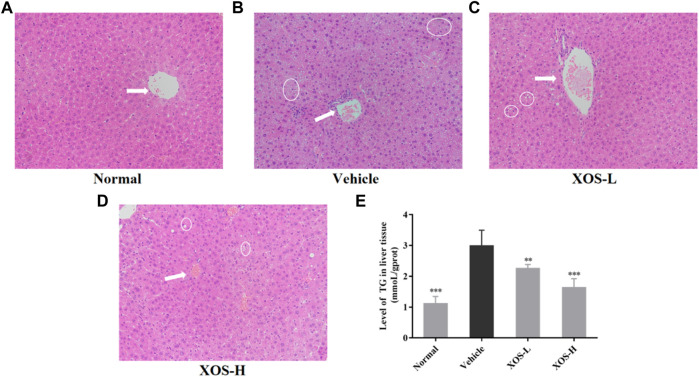
FIGURE 4.
(A–D) Effect of XOS supplementation on H&E pathological observation of liver tissue in mice. Magnification 10×; (E) Level of TG in liver tissue. XOS-L: mice treat with XOS 250 mg/kg, XOS-H: mice treat with XOS 500 mg/kg. The arrow indicates the central vein, the circled indicates lipid drop. **p < 0.01, ***p < 0.001 compared with the Vehicle group.

