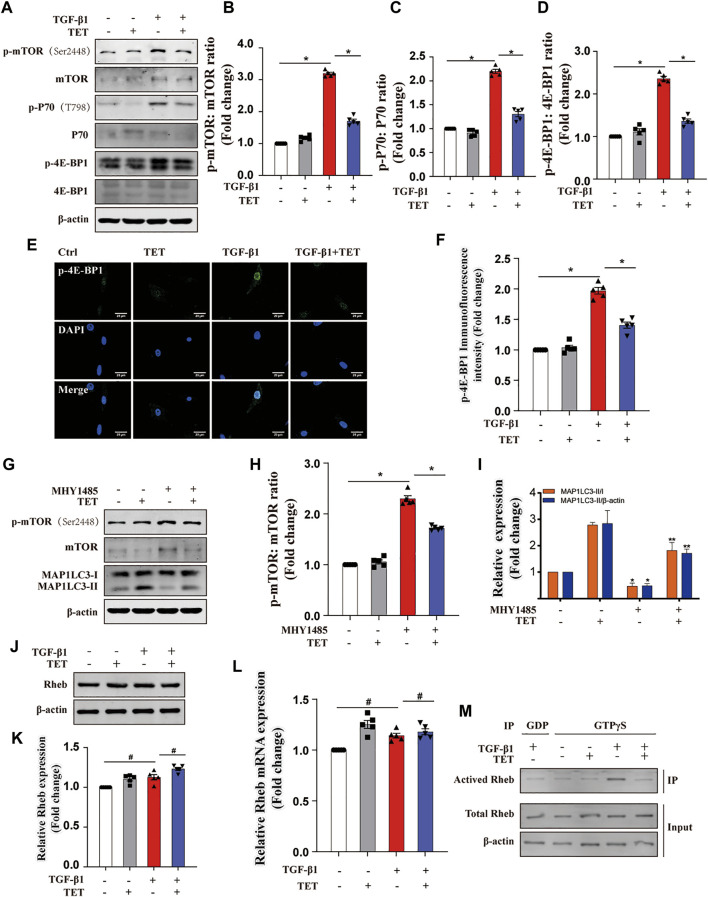
FIGURE 6.
TET activates autophagy by inhibiting Rheb/mTORC1 signaling. (A–D) Effect of TET on mTOR activation. Immunoblot (A) and quantitative analysis (B–D) showed the expression level of mTOR phosphorylation (p-mTOR), mTOR downstream substrates (p-P70, p-4E-BP1). (E,F) Representative images of immunofluorescence monitored by confocal microscopy (J) and quantitative analysis (K) showed the expression of p-4E-BP1. Green staining is p-4E-BP1, blue staining indicates nuclei. Scale bars: 20 μm. (G–I) Effect of mTOR activation on autophagy regulation. Primary MLFs were cotreated with TET (4 μM) and MHY1485 (5 μM) for 24 h. Immunoblot (G) and quantitative analysis (H–I) showed the expression of autophagy markers (MAP1LC3-I/II, SQSTM1), mTOR activation (mTOR, p-mTOR). (J,K) Effect of TET on the expression of Rheb protein. Representative immunoblot analysis (J) and quantitative analysis (K) show the expression of Rheb protein. (L) Representative of qPCR analysis showed the mRNA expression of Rheb. (M) Effect of TET on Rheb activation. Co-immunoprecipitation was performed using agarose beads conjugated to an antibody directed against the GTPγS and GDP. Immunoblot analysis was performed to check for protein expression of activated Rheb (Rheb/GTP), total Rheb. Total Rheb includes the inactive GDP-Bound form (GDP) and activated Rheb (Rheb/GTP). Values in bar graph are presented as means ± SEM (n = 5). Two-way ANOVA with Tukey’s multiple comparison test (n = 5). *p < 0.05.

