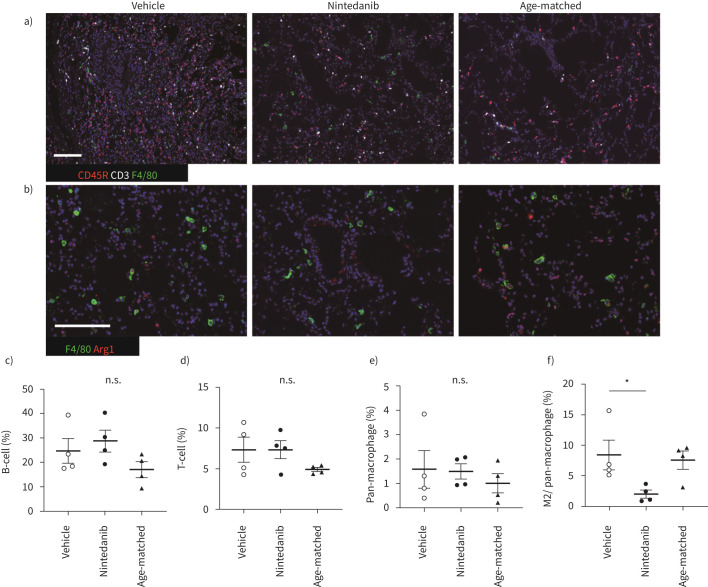
FIGURE 3.
M2 macrophage polarisation was suppressed by nintedanib treatment. a and b) Immunohistochemical staining for F4/80 (green), CD45R (red) and CD3 (white) (a), F4/80 (green) and arginase I (red) (b). Scale bars=50 μm. c–f) The percentage of each infiltrated lymphoid cell is calculated. B-cells (c), T-cells (d), pan-macrophages (e) and the ratio of M2 macrophage in pan-macrophages (f). Images from each immunohistochemical staining in left lung and accessory lobe, which are captured at a magnification of 100× and calculated the ratio of each lymphoid cell for total nuclear cells by Fiji or M2 macrophages in pan-macrophages by hybrid cell count. All data are presented as mean±se of four mice in each group. *p<0.05 compared with vehicle group. n.s.: non-significant.

