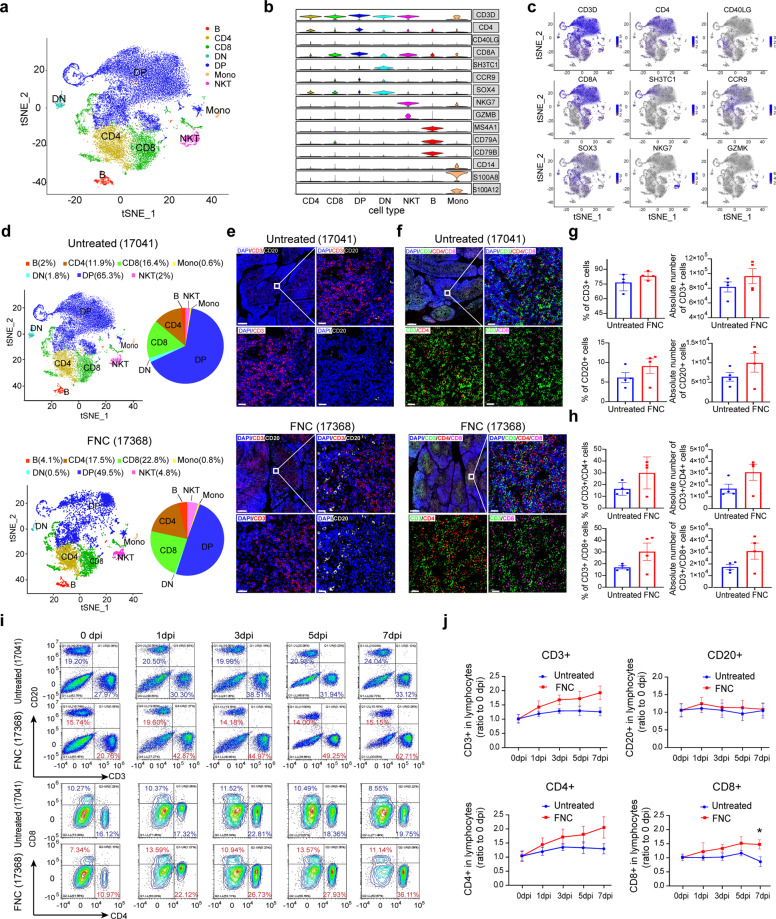
Fig. 6.
FNC improves the profile of immune cells in RM monkey. The droplet-based scRNA-seq (10Χ Genomics) was performed to characterize the immune cell features in the thymus of RM monkeys inoculated with SARS-CoV-2, untreated (#17041) or treated (#17368) with FNC. a Through analysis of 27,751 single cells from the thymus samples of monkey #17,041 (untreated) and #17,368 (treated with FNC), 7 clusters with the respective labels were identified. Each colored dot represents a single cell, according to cell type. b Expression of selected canonical cell markers in the 7 clusters showing with violin images. Columns represent clusters and rows represent selected marker genes. c The clusters were labeled by canonical cell gene markers (blue dots). d Proportion of each cell type from samples of untreated (up) and FNC treated monkey (bottom). e The representative images of multi-color immunofluorescent staining were for CD3 (red) and CD20 (white) protein in the thymus from monkey 17,041 (untreated) and 17,368 (FNC treated). The regions of interest (ROI) are boxed in white (up left), and their magnified photos are shown in the upright. The bottom left is for CD3+ cells, and the bottom right is for CD20+ cells. f The representative images of multi-color immunofluorescent staining was for CD3 (green), CD4 (red), and CD8 (purple) protein in the thymus of virus (+) monkeys treated or untreated with FNC. The regions of interest (ROI) are boxed in white (up left), and their magnified photos are shown in the upright. Bottom left is for CD3+/CD4+ cells, and the bottom right is for CD3+/CD8+ cells. g Relative proportion and absolute numbers of CD3+ cells (up) and CD20+ cells (down) in thymus from the virus (+) monkeys, treated with or without FNC (n = 4 for each group). Cells of a given phenotype were identified and quantitated using the Tissue Quest software (Tissue Gnostics). h Relative proportion and absolute numbers of CD3+/CD4+ cells (up) and CD3+/CD8+ cells (down) in thymus from virus (+) monkeys, treated with or without FNC. Cells of a given phenotype were also analyzed using the Tissue Quest software (Tissue Gnostics). i Representative flow cytometry analysis of CD3+/CD20+ cells (up) and CD4+/CD8+ cells (down) in PBMC samples from #17,041 and #17,368 at indicated time points. j FNC increased the % of CD3+, CD4+, and CD8+ cells in PBMC of the virus-infected monkeys, measured with flow cytometer at indicated time points. Data are presented as mean ± SEM (n = 4); *p < 0.05, infected monkeys in FNC group vs. those in the untreated group, by Mann–Whitney U test. Scale bars for e and f 200 µm (up left) and 20 µm (upright, bottom left and bottom right)

