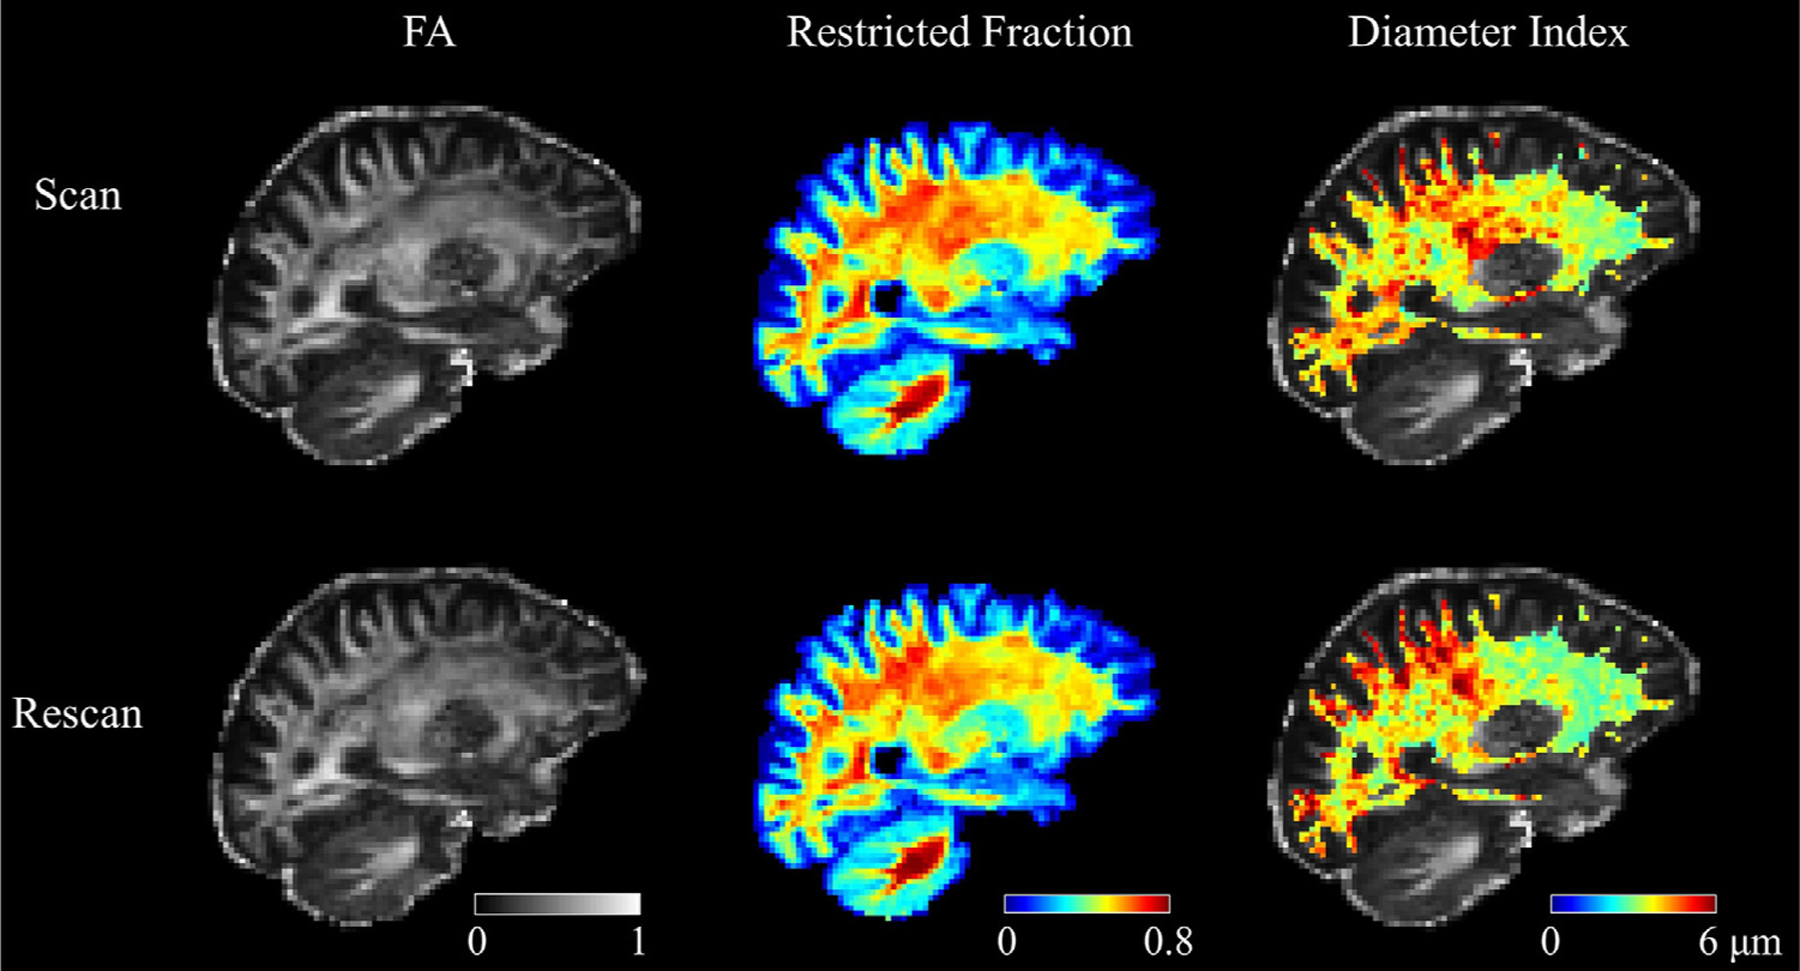
Fig. 1.

Representative FA, restricted volume fraction, and apparent axon diameter index maps in a healthy subject from scan (upper panel) and rescan (lower panel) sessions. The maps are displayed in the halfway point between the two sessions, such that identical anatomical regions can be compared. The visual consistency between the scan and rescan results can be appreciated from the maps.
