Fig. 4. b.

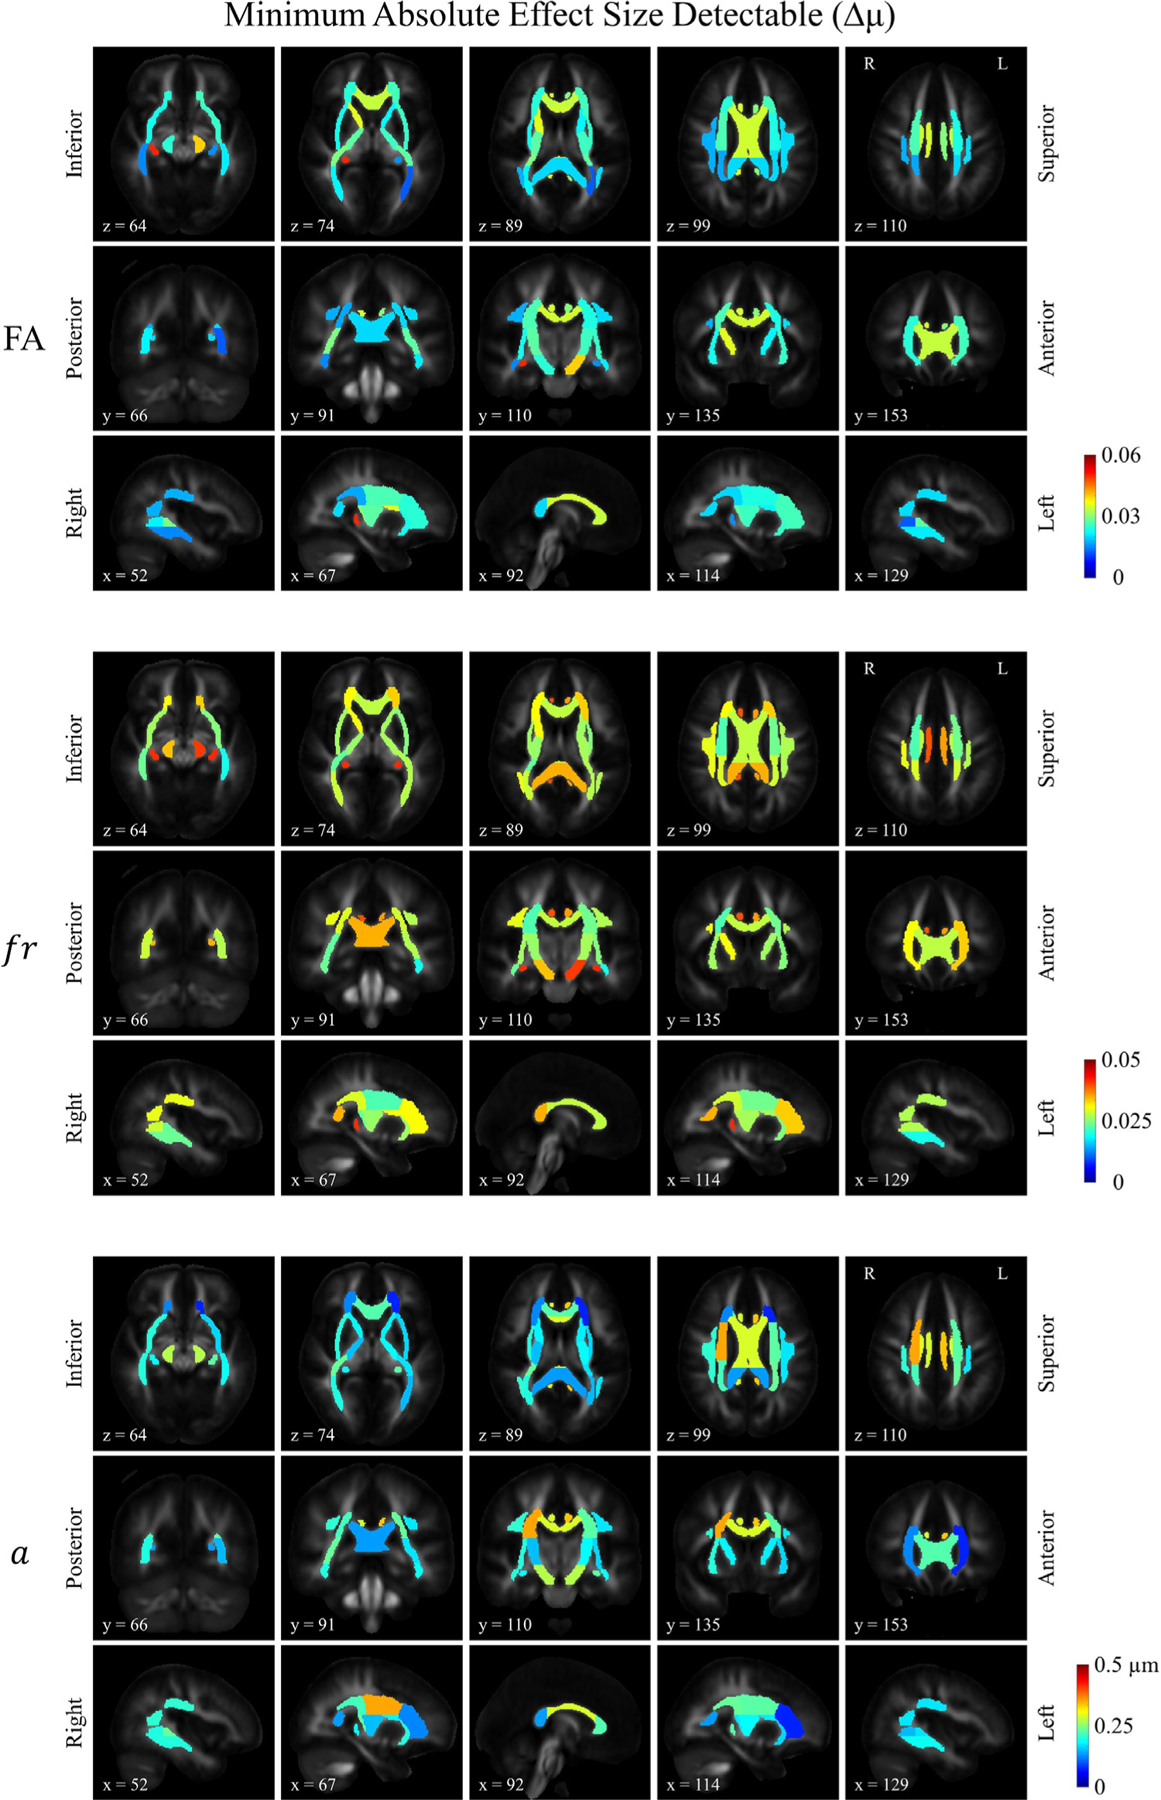
Distribution of the estimated minimum absolute effect size detectable for FA, restricted volume fraction (fr) and axon diameter index (a). The same slices were shown as in Figure 4a.

Distribution of the estimated minimum absolute effect size detectable for FA, restricted volume fraction (fr) and axon diameter index (a). The same slices were shown as in Figure 4a.