
Fig. 4. c.
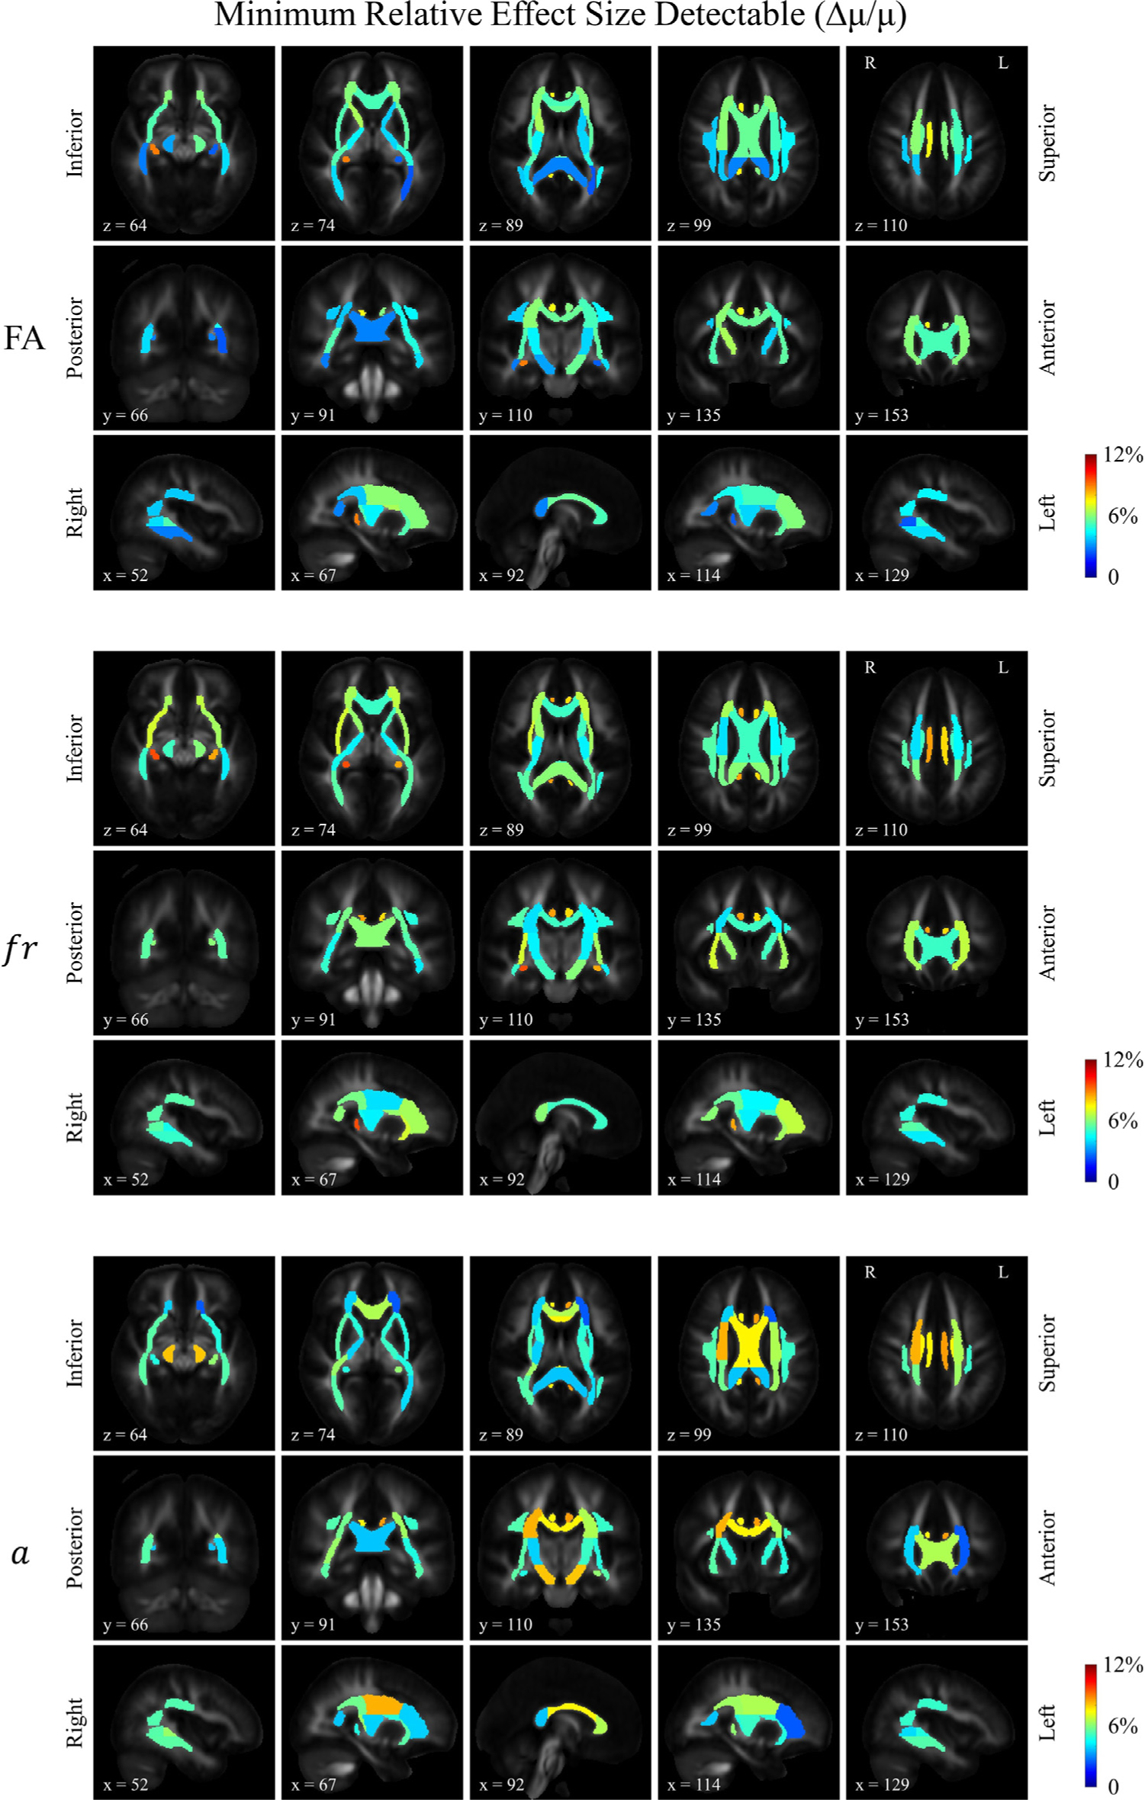
Distribution of the estimated minimum relative effect size detectable for FA, restricted volume fraction (fr) and axon diameter index (a). The minimum detectable relative effect size was calculated by dividing the minimum absolute detectable effect sizes in Figure 4b by the group means in Figure 4a.