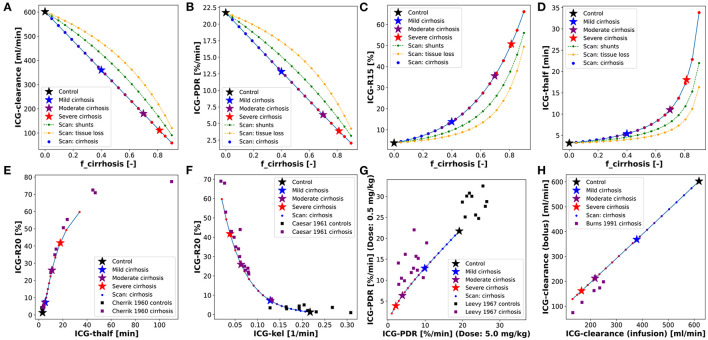
Figure 4.
Dependency of ICG pharmacokinetic parameters on cirrhosis. Simulations of 4 specific cirrhosis degrees are indicated by stars. (A–D) Dependency of ICG pharmacokinetic parameters on the degree of shunting (green), degree of tissue loss (yellow) and degree of cirrhosis (black-blue-red). (E) Correlation between ICG-R20 and ICG-t1/2 in cirrhotic and control subjects (Cherrick et al., 1960). (F) Correlation between ICG-R20 and ICG-kel in cirrhotic and control subjects (Caesar et al., 1961). (G) Correlation between ICG-PDR after an ICG dose of 0.5 and 5.0 mg/kg in control subjects and subjects with various liver diseases (Leevy et al., 1967). (H) Correlation between ICG-clearance after a bolus administration and during a constant infusion of ICG in cirrhotic subjects (Burns et al., 1991).

