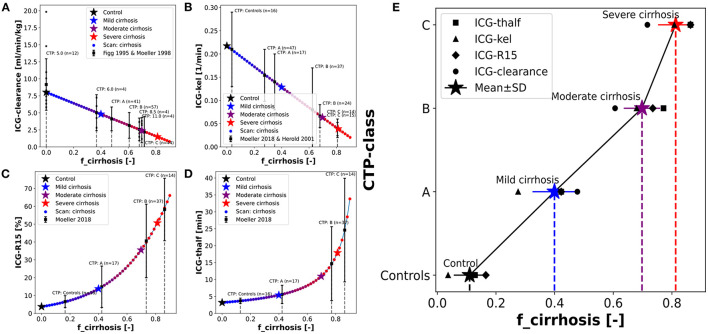
Figure 5.
Mapping of model cirrhosis degree on CTP-score. (A) Mapping based on ICG clearance (Figg et al., 1995; Møller et al., 1998). (B) Mapping based on ICG-kel (Herold et al., 2001; Møller et al., 2019). (C) Mapping based on ICG-R15 (Møller et al., 2019). (D) Mapping based on ICG-thalf (Møller et al., 2019). (E) Resulting fcirrhosis values for each CTP-class combining the information from the mappings based on individual ICG pharmacokinetic parameters (Control: fcirrhosis = 0.0; Mild cirrhosis: 0.41; Moderate cirrhosis: 0.70; Severe cirrhosis: 0.82).

