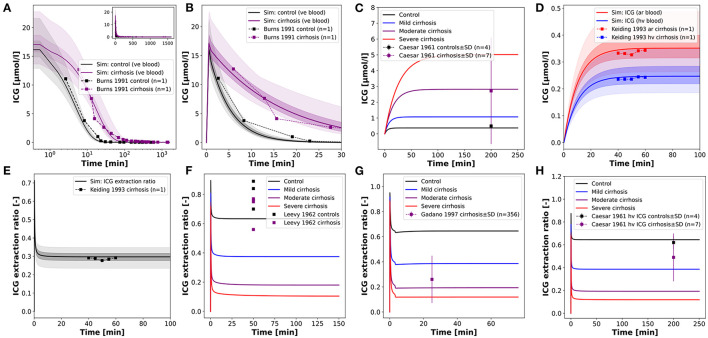
Figure 6.
Model prediction of ICG time courses in subjects with cirrhosis. (A,B) Venous concentration after a bolus ICG administration in a healthy subject and a cirrhotic patient (fcirrhosis was set to 0.7 corresponding to moderate cirrhosis) (Burns et al., 1991). (C) Venous concentration during a constant ICG infusion in healthy and cirrhotic subjects (Caesar et al., 1961). (D,E) Hepatic venous and arterial ICG concentration and ICG extraction ratio in a cirrhotic patient (fcirrhosis was set to 0.54 corresponding to mild-moderate cirrhosis) (Keiding et al., 1993). (F–H) ICG extraction ratio in cirrhotic and control subjects during a constant ICG infusion (Caesar et al., 1961; Leevy et al., 1962; Gadano et al., 1997).

