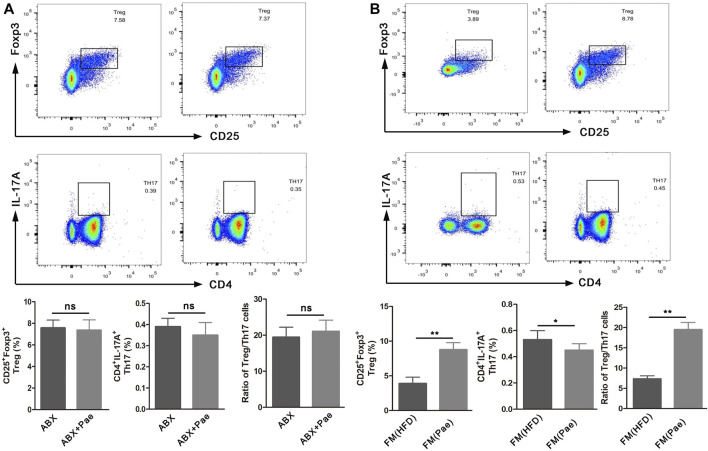
FIGURE 5.
The frequency of Treg cells and Th17 cells in ApoE-/- mice after gut microbiota depletion and FMT. (A) Representative plot and graph analysis of Treg (CD4+CD25+Foxp3+) cells and Th17 (CD4+IL17A+) cells in the spleen from ABX and ABX+Pae groups. (B) Representative plot and graph analysis of Treg (CD4+CD25+Foxp3+) cells and Th17 (CD4+IL17A+) cells in the spleen from FM(HFD) and FM(Pae) groups. Data are presented as mean ± SEM, n = 6. * p < 0.05, ** p < 0.01.

