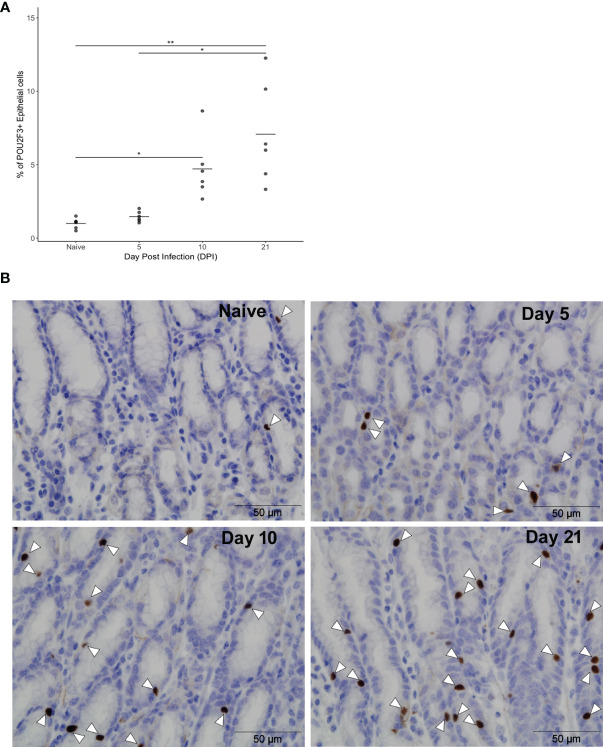
Figure 2.
Frequency of ovine abomasal tuft cells increases following GI nematode infection. (A) Percentages of POU2F3+ cells in total epithelium in naïve sheep and at days 5, 10 and 21 following Teladorsagia circumcincta infection. The percentage of POU2F3+ cells from five areas per tissue section was calculated from each of six animals per group as detailed in Supplementary Table 4 . Tuft cells represented 0.9% ± 0.3 (mean ± standard deviation), 1.5% ± 0.4, 4.7% ± 2.1 and 7.1% ± 3.4 of epithelial cells in the abomasum of naïve animals and at days 5, 10 and 21 p.i., respectively. * indicates P ≤ 0.05; ** indicates P ≤ 0.01. P values were calculated using a Dunn’s Multiple comparison test. Horizontal lines indicate mean values. (B) Representative images of POU2F3+ cells (brown) in the ovine abomasum epithelium from naïve sheep and at days 5, 10 and 21 after T. circumcincta infection. White arrowheads indicate POU2F3+ cells.

