Figure 3.
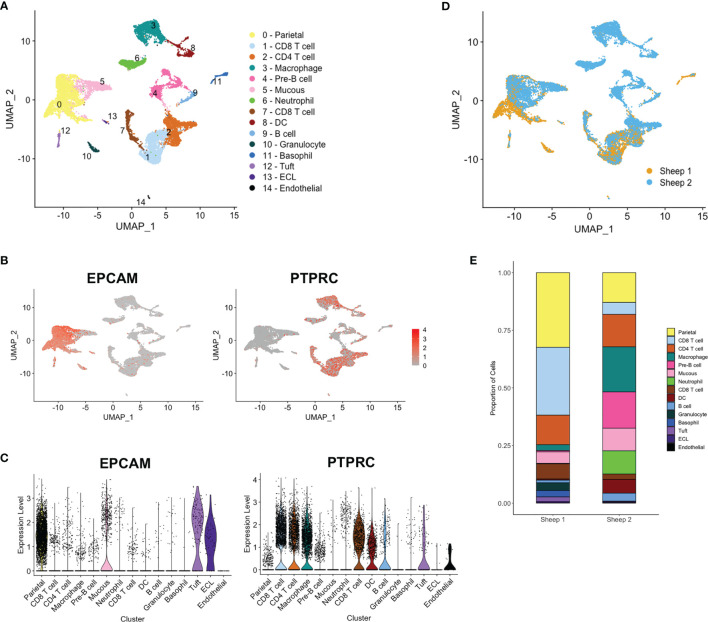
Single cell RNA sequencing (scRNA-seq) identifies distinct ovine abomasal cell clusters. (A) UMAP (Uniform manifold approximation and projection) plot of cell clusters identified from integrated data from sheep 1 and 2 following mapping to bovine genome. DC - dendritic cells, ECL - enterochromaffin-like cells. Cell clusters were putatively identified by expression of marker genes (see Supplementary Table 6 ). Expression of epithelial cell marker EPCAM and immune marker PTPRC (CD45) across all clusters, shown by (B) UMAP and (C) violin plots. (D) UMAP plot of sheep 1 and 2 overlapped. (E) Relative proportion of cells within each cluster for sheep samples 1 and 2.

