Figure 5.
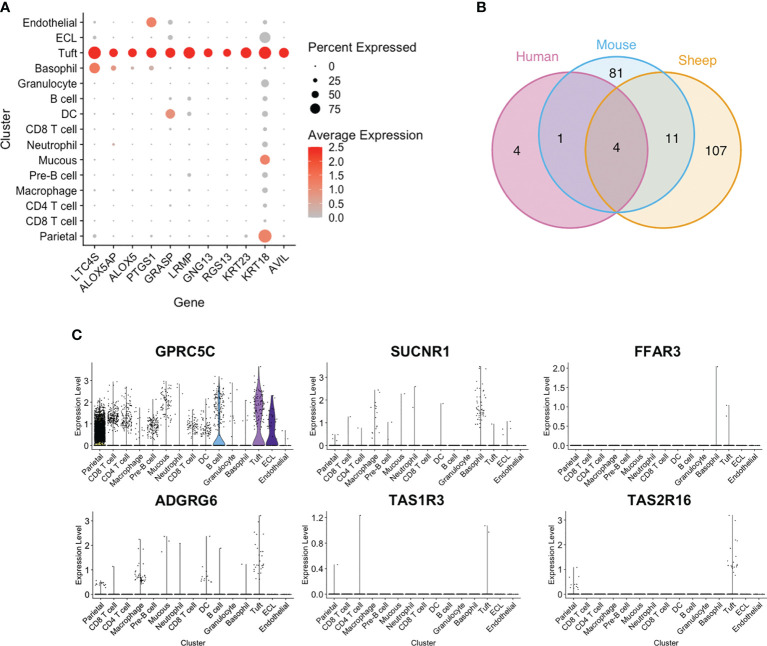
Conservation and divergence of genes associated with tuft cell function. (A) Dot plot showing log-normalised expression of selected tuft cell genes across clusters. (B) Venn diagram of ovine abomasal and mouse SI tuft cell enriched genes (Log2 fold change >0.5; FDR < 0.05), and genes conserved in human tuft cells from different tissues. Ovine, human and mouse data from this study, and (9, 32), respectively. The four genes conserved in all three species are AVIL, ALOX, ALOX5AP, PTGS1; the 11 genes conserved in sheep and mouse are GNG13, LRMP, LTC4S, RGS13, KRT18, KRT23, BMX, SPIB, SH2D7, TSPAN6, TMEM45B. (C) Violin plot of log-normalised expression of GPCRs across all clusters.

