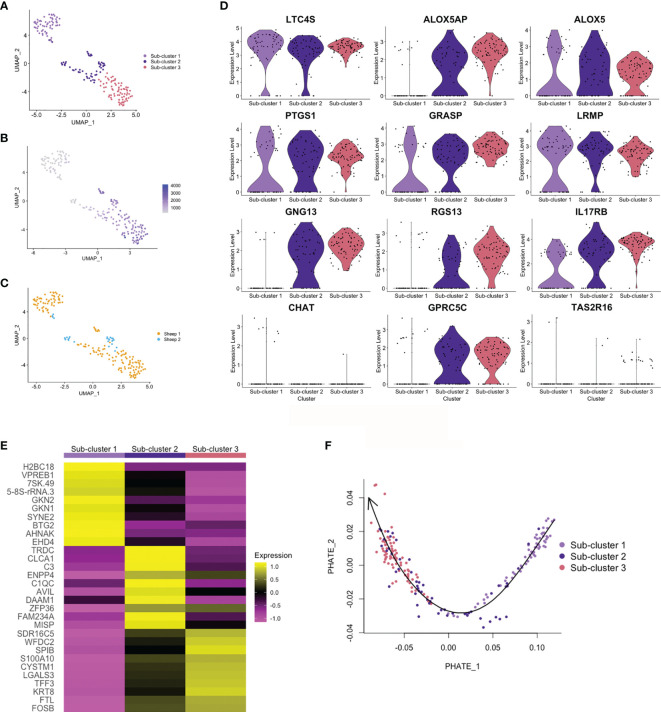
Figure 6.
Trajectory analysis of ovine abomasal tuft cell sub-clusters. (A) UMAP plot of ovine tuft cell sub-clusters 1, 2, 3. (B) UMAP plot showing gene expression (UMI) across sub-clusters. (C) UMAP plot of sheep 1 and 2 tuft cell sub-clusters overlapped. (D) Violin plots showing log-normalised expression of selected tuft cell genes across sub-clusters. (E) Heatmap of top 10 marker genes in ovine tuft cell sub-clusters (see Supplementary Table 8 for full gene lists). (F) PHATE (Potential of Heat-diffusion for Affinity-based Transition Embedding) plot of sub-cluster gene expression. Arrow on Slingshot line shows suggested direction of lineage, added manually, starting at sub-cluster 1.

