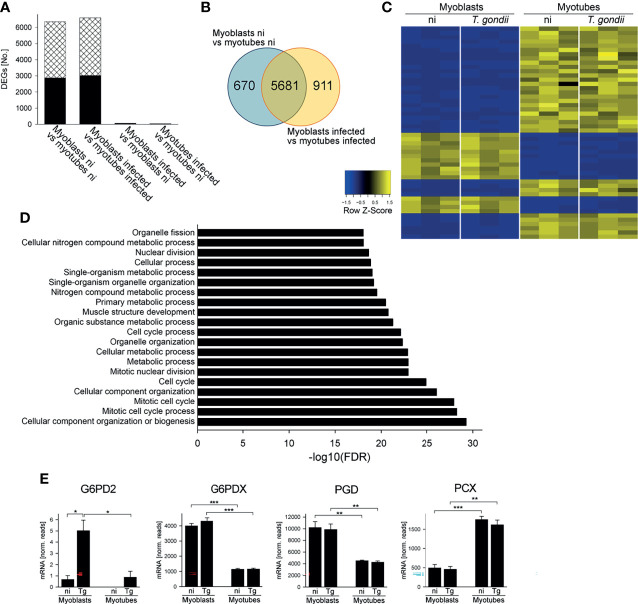
Figure 1.
Myoblasts and myotubes during infection with T. gondii diverge in their transcriptome profiles including multiple mRNAs of carbohydrate metabolic enzymes. C2C12 myoblasts and in vitro-differentiated C2C12 myotubes were infected with T. gondii at a MOI of 5:1 for 24 hours or were left non-infected. Total RNA from three biological replicates each was used to prepare cDNA libraries which were then sequenced using Illumina technology. Reads were mapped to the Mus musculus reference genome. (A) Numbers of differentially expressed genes (DEGs; padjusted < 0.05) which were up- or down-regulated (black bars and cross-hatched bars, respectively) between myoblasts and myotubes or after infection as indicated. (B) Venn diagram of total DEGs identified between myoblasts and myotubes that were either non-infected (ni) or T. gondii-infected. (C) The top 50 genes that were most significantly regulated between infected myoblasts and myotubes were hierarchically clustered. Their expression levels from three biological replicates each of non-infected (ni) and infected (T. gondii) myoblasts and myotubes were visualized in a heatmap. (D) DEGs identified between infected myoblasts and myotubes were functionally analyzed for enrichment of gene ontology (GO) terms. The 20 GO biological processes which were most significantly enriched are depicted. (E) Expression levels of G6PD2, G6PDX, PGD and PCX were extracted from the RNAseq data sets and are depicted as means ± S.E.M. from three biological replicates. Significant differences were identified by Student’s t-test (*p < 0.05; **p < 0.01; ***p < 0.001).

