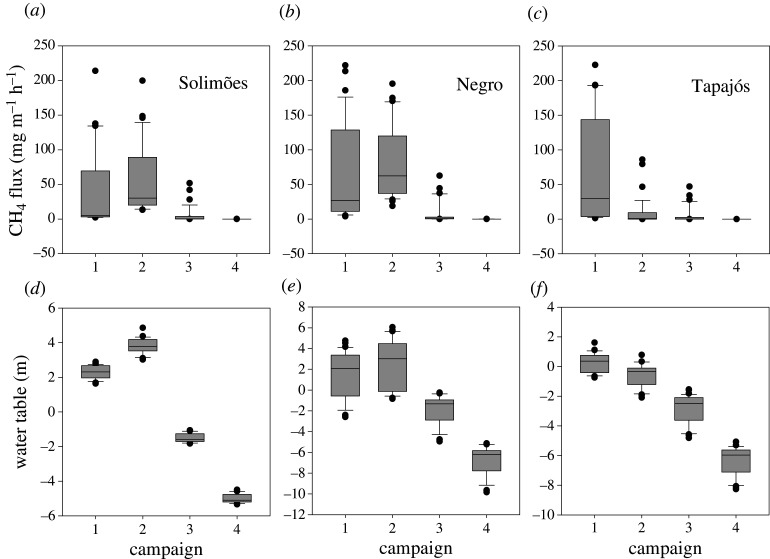
Figure 2.
Box and whisker plots of seasonal changes in tree CH4 flux measured at 20–50 cm above the forest floor (either soil or water depending on the state of flood) for the three study plots in each catchment (a–c). Figure (d–f) demonstrates the corresponding water table for each location at each seasonal time point. Campaigns 1 through 4 were carried out, respectively, during rising (campaign 1; April 2017), peak (campaign 2; July 2017), receding (campaign 3; October 2017) and low water table conditions (campaign 4; January 2018). Error bars indicate the 10th and 90th percentiles.

