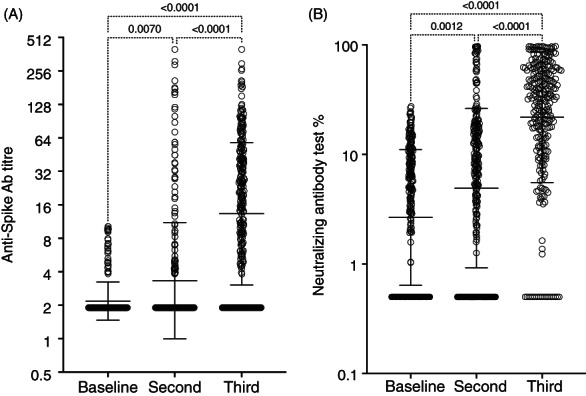
FIGURE 3.

(A) Antibody results from the patients completing all three follow up. The data is not normally distributed, and titres are shown on a log2 axis. Significance was assessed by Friedman test and shown in dotted brackets. Geometric mean and confidence intervals are shown as large and small bars respectively (n = 269). (B) Anti‐neutralizing antibody assay percentage. Axis Log10. Geometric mean and CI plotted as wide and narrow bars at baseline, After 1 and 2 doses of the vaccine. Significance was assessed by Friedman test and shown in dotted brackets (n = 269)
