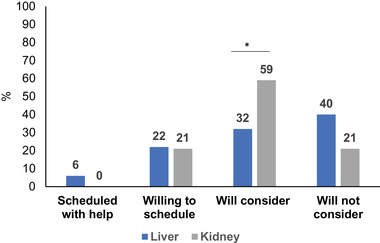
FIGURE 2.

Percentage COVID‐19 vaccination outcomes by organ type (n = 50 LTR, n = 53 KTR)
*p < 0.05 in bivariate comparisons liver versus kidney transplant recipients. Abbreviations: KTR, kidney transplant; LTR, liver transplant

Percentage COVID‐19 vaccination outcomes by organ type (n = 50 LTR, n = 53 KTR)
*p < 0.05 in bivariate comparisons liver versus kidney transplant recipients. Abbreviations: KTR, kidney transplant; LTR, liver transplant