FIGURE 2.

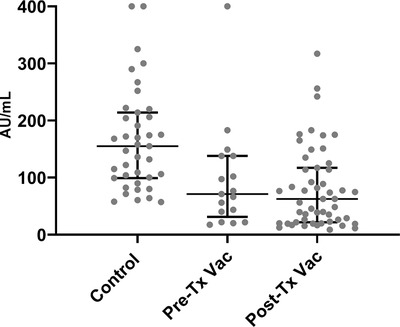
Scatter plot of IgG anti S in participants who were seropositive in three study groups. Control group differed significantly from both recipients’ groups, P < .001

Scatter plot of IgG anti S in participants who were seropositive in three study groups. Control group differed significantly from both recipients’ groups, P < .001