Figure 1.

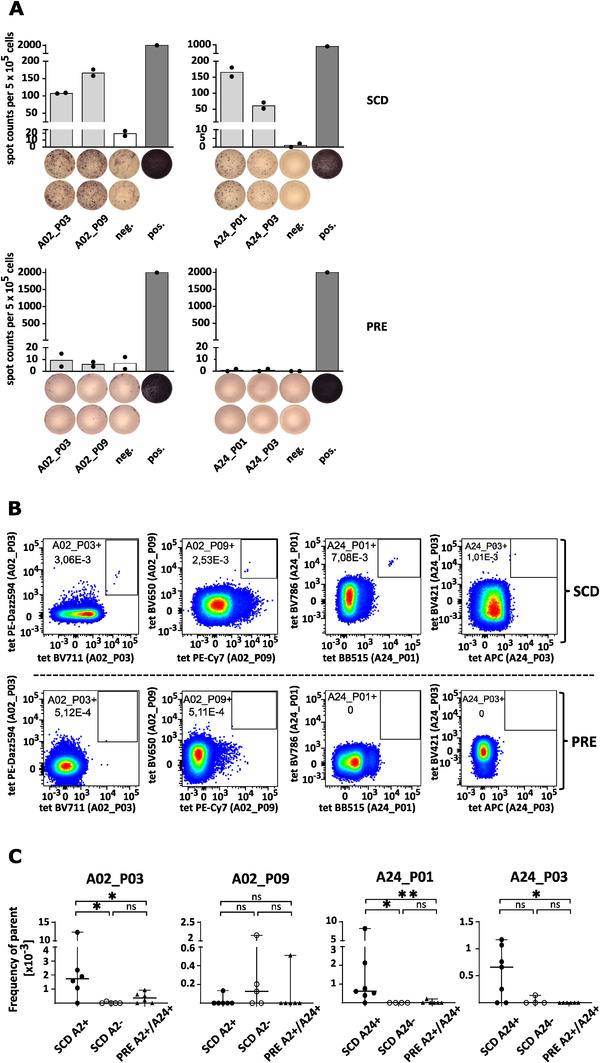
SARS‐CoV‐2 tetramer‐positive cells enriched in convalescent samples. (A) Representative IFN‐γ ELISPOT assays of peptide‐specific T cells from HLA‐matched SARS‐CoV‐2 convalescent donors (SCD‐12 and SCD‐13) (SCD, upper row) and unexposed prepandemic healthy donors (PRE, lower row) after 12‐d in vitro stimulation with SARS‐CoV‐2‐derived HLA‐A*02‐ and A*24‐binding peptides. T‐cell responses were considered positive when the mean spot counts in ELISPOT assays were at least threefold higher than the negative control. ELISPOT data are presented as a scatter dot plot with mean. Neg. = negative control using an irrelevant HLA‐matched peptide (HLA‐A*02 YLLPAIVHI DDX5_HUMAN148‐156, HLA‐A*24 AYVHMVTHF BI1_HUMAN45‐53). Pos. = positive control (PHA). The experiment was conducted once with technical duplicates. (B) Exemplary 2D tetramer FACS plots for convalescent (SCD, upper panel) or prepandemic healthy donor control samples (PRE, lower panel). An equal number of CD8+ T cells as parent population is shown for all samples. The depicted numbers in the gates indicate the respective frequency of parent. Axis are scaled logarithmically. The respective target antigen is indicated on the axis in brackets. For an example of the full gating strategy, please refer to Supporting information Fig. S1. (C) Scatter plot showing the cumulative frequencies of tetramer‐positives cells in convalescent samples (subdivided into HLA/target matched and unmatched) compared to prepandemic controls. Statistical significance was determined with the Mann Whitney test using GraphPad Prism (*p < 0.05, **p < 0.01, ns, not significant). The experiment was conducted once, n (SCD) = 11, n (PRE) = 6.
