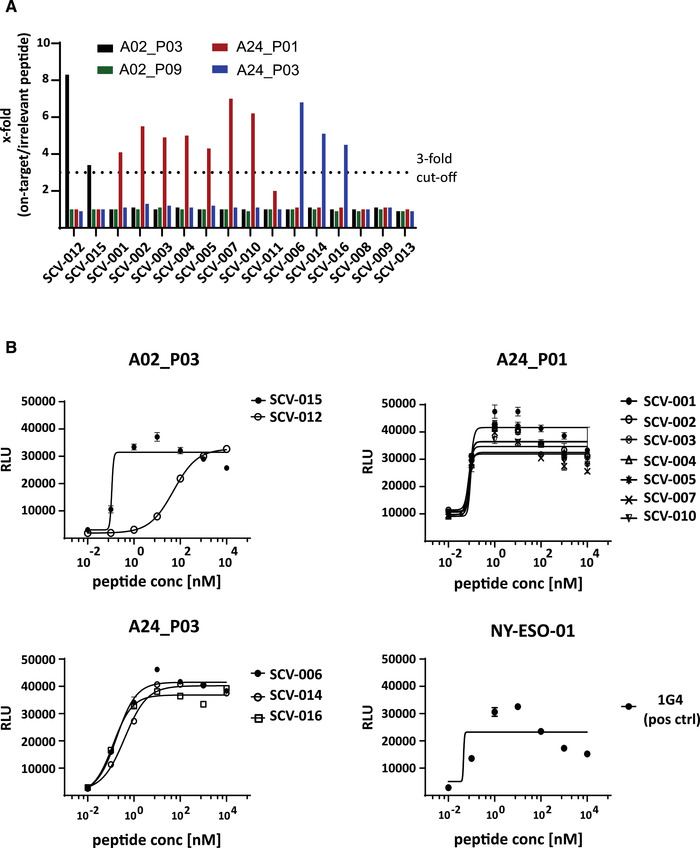
Figure 2.

Signaling of SARS‐CoV‐2 TCRs and EC50 determination. The identified unique SARS‐CoV‐2 TCRs were electroporated into KO‐Jurkat cells expressing a NFAT‐luciferase reporter to determine reactivity and potency. TCR‐reconstituted KO‐Jurkat cells were used as effector cells and cocultured with T2 cells, pulsed with target peptide or irrelevant control peptide. (A) Bar graph summarizing the NFAT luciferase reporter response against the four target peptides, shown as fold change compared to the irrelevant peptide control. The dotted line indicates the threefold threshold. TCRs are grouped by their target reactivity. Experiment was conducted once with triplicates. (B) EC50 dose‐response curves, grouped by target epitope. Dots mark the relative light units (RLU) values measured for each individual peptide concentration (10 pM to 10 μM). Curves show the nonlinear curve fit (4PL sigmoidal) calculated with GraphPad Prism. Data shown are representative of two independently conducted experiments (n = 2) with technical triplicates.
