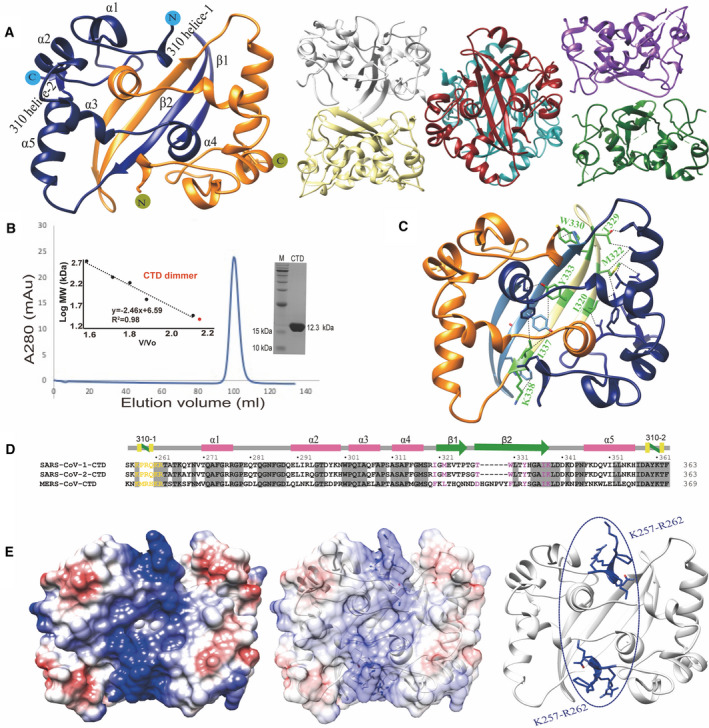
Fig. 6.

Crystal structures of N‐protein CTD. (A) The crystal structures of N‐protein CTD with 2 monomers in ASU (left) and 12 monomers in ASU (right). (B) Elution profile of N‐protein CTD by SEC using a Superdex 200 16/600 column (GE Healthcare). The inset shows the plotted standard curve for this column and the representative 15% SDS/PAGE showing the purified CTD protein. (C) The crystal structure of dimeric CTD shows the residues involved in dimer formation. (D) Sequence alignment of CTDs among SARS‐CoV‐1, SARS‐CoV‐2, and MERS. The residues involved in RNA‐binding are colored in yellow and involved in dimerization are colored in pink. (E) Surface view of dimeric CTD shows a positive binding pocket consisted of a stretch of positively charged residues between Lys257 and Arg262.
