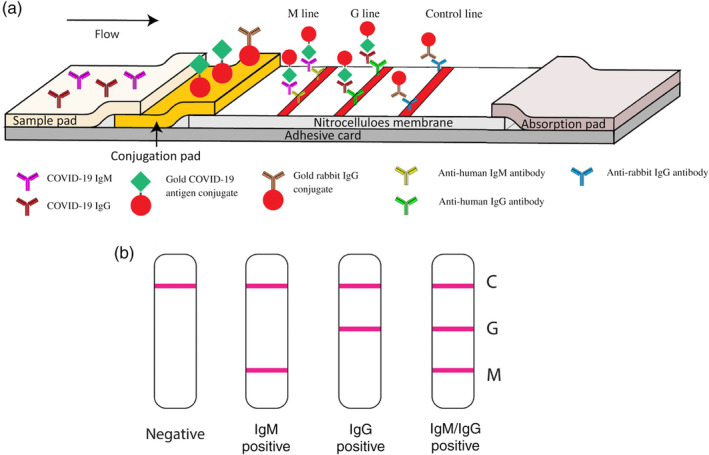
FIGURE 18.

Schematic illustration of rapid SARS‐CoV‐2 IgM‐IgG combined antibody test. (a) Schematic diagram of the detection device. (b) An illustration of different testing results, C: control line; G: IgG line; M: IgM line. Reprinted with permission from Li et al. (2020). John Wiley & Sons, Inc
