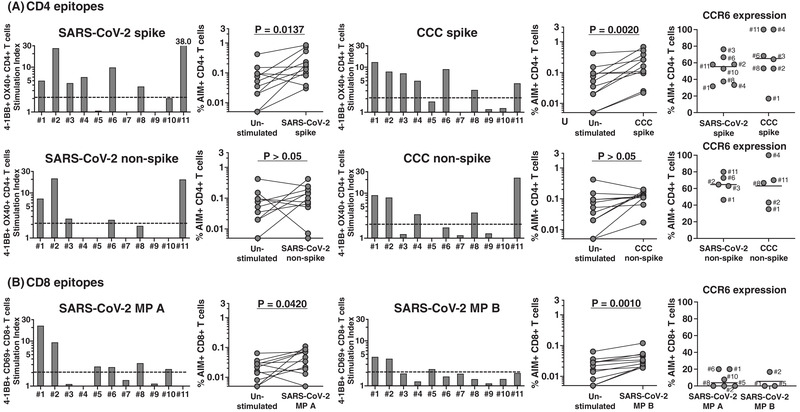
Figure 1.

CD4+ and CD8+ T‐cell responses to peptide megapools derived from SARS‐CoV‐2 and CCC and their CCR6 expression in MIS‐C subjects. PBMC from 11 MIS‐C subjects were separated from heparinized whole blood using Histopaque and stimulated with peptide megapools derived from SARS‐CoV‐2 CD4 spike (253 epitopes), CCC CD4 spike (124 epitopes), SARS‐CoV‐2 CD4 nonspike (221 epitopes), CCC CD4 nonspike (129 epitopes), or SARS‐CoV‐2 CD8 (MP A and B, 314 epitopes each). Twenty‐four hours after stimulation, cell preparations were collected and stained by monoclonal antibodies to study the T‐cell activation in response to megapool stimulation and the CCR6 expression of the antigen‐specific CD4+ and CD8+ T cells by flow cytometry. The T‐cell response to the megapools is shown as stimulation index (SI) by calculating the percentage of activated T cells in response to peptide megapools divided by the percentage of activated T cells in the unstimulated controls. A stimulation index (SI) ≥2 was considered a positive T‐cell response to the megapool. (A) CD4+ T‐cell responses and CCR6 expression to CD4 peptide megapools in individual MIS‐C subjects. CD4+ T‐cell activation was defined with the double expression of 4‐1BB+ OX40+ in gated CD4+ T cells (AIM+). Seven (#1, 2, 3, 4, 6, 8, and 11) of the 11 subjects showed CD4+ T‐cell responses to SARS‐CoV‐2 and CCC CD4 spike megapools. Three subjects (#1, 2, and 11) also showed CD4+ T‐cell responses to both SARS‐CoV‐2 and CCC CD4 nonspike megapools. CD4+ T‐cell response toward peptide antigens derived from spike protein of both SARS‐CoV‐2 (p = 0.0137) and CCC (p = 0.002) was greater than the response to peptide antigens derived from nonspike protein. The percentage of CCR6+ CD4+ T cells was high in the antigen‐specific T‐cell populations. (B) CD8+ T‐cell responses and CCR6 expression to CD8 peptide megapools in each individual MIS‐C subject. CD8+ T‐cell activation was measured as 4‐1BB+ CD69+ (AIM+) following megapools stimulation. Six subjects (#1, 2, 5, 6, 8, and 10) responded to SARS‐CoV‐2 MP A and three (#1, 2, and 5) also responded to SARS‐CoV‐2 MP B. The percentage of CCR6+ CD8+ T cells was low in the antigen‐specific T‐cell populations. Symbols represent the data derived from each individual subject. The study of 11 subjects was completed in seven independent experiments (one or two subjects/experiment depending upon enrollment). Comparisons of the percentage of AIM+ T cells in the unstimulated control and peptide megapool‐stimulated cultures were tested by Wilcoxon signed rank test.
