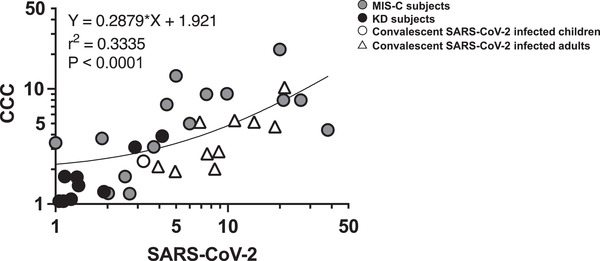
Figure 6.

Correlation of CD4+ T‐cell responses to SARS‐CoV‐2 and CCC. The correlation of the SI from the individual subject in response to CD4 spike megapools derived from SARS‐CoV‐2 versus CCC and to CD4 nonspike megapools derived from SARS‐CoC‐2 versus CCC from all the cohorts were studied. Symbols represent the data derived from individual subjects including MIS‐C, convalescent SARS‐CoV‐2‐infected, and KD subjects with a total of 28 subjects studied in 14 independent experiments. A strong correlation of the CD4+ T‐cell responses was found between SARS‐CoV‐2 and CCC (p < 0.0001) suggesting a cross‐reactivity of the T‐cell response between SARS‐CoV‐2 and CCC and/or a previous exposure of CCC of the subjects. Pearson's correlation test was used. Circles: pediatric subjects; triangles: adult subjects; gray symbols: MIS‐C; black symbols: KD; white symbols: convalescent SARS‐CoV‐2‐infected subjects.
