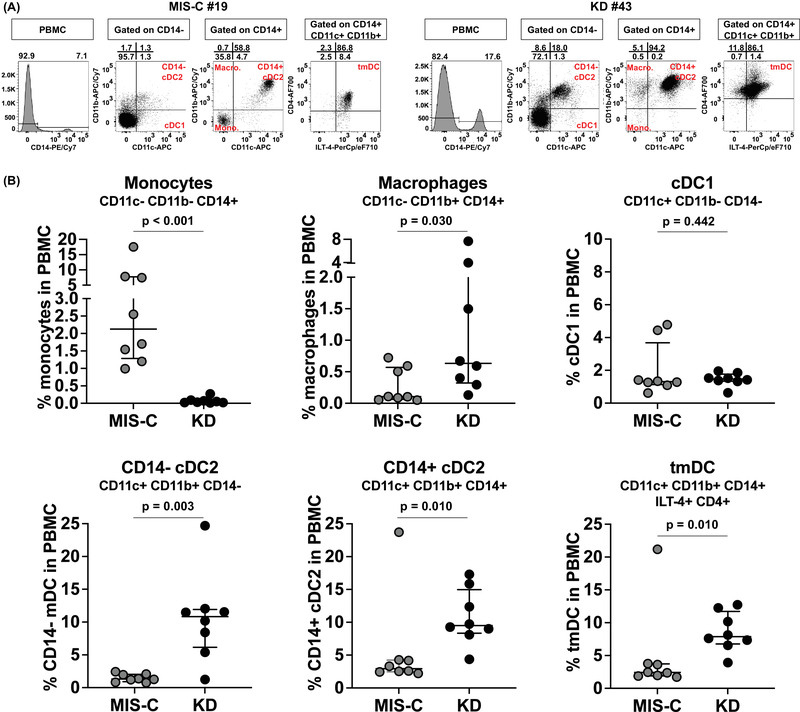
Figure 7.

Enumeration of innate APC in the PBMC from MIS‐C and KD subjects. Eight MIS‐C subjects (#13–20) and eight subacute KD subjects (#38–45) were enrolled to study their innate APC populations by staining the PBMC with a combination of monoclonal antibodies. Monocytes (CD11c‐ CD11b‐ CD14+), macrophages (CD11c‐ CD11b+ CD14+), cDC1 (CD11c+ CD11b‐ CD14‐), CD14‐ cDC2 (CD11c+ CD11b+ CD14‐), CD14+ cDC2 (CD11c+ CD11b+ CD14+), and tmDC (ILT‐4+ CD4+ CD14+ cDC2) were enumerated from each subject. (A) Representative FACS plots showing the gating of different innate APC populations from one MIS‐C subject (#19) and one subacute KD subject (#43). (B) Percentage of each innate APC population in the PBMC from the eight MIS‐C (grey) and eight subacute KD subjects (black). Symbols represent the data derived from each individual subject. A total of 16 subjects were studied in ten independent experiments. Median ± interquartile ranges are indicated in the figure. Comparisons of the percentage of each innate APC population between subacute MIS‐C and KD subjects were tested by Mann–Whitney U tests. MIS‐C subjects showed a higher percentage of monocytes (p < 0.001) but lower percentages of macrophages (p = 0.03), CD14‐ cDC2 (p = 0.003), CD14+ cDC2 (p = 0.01), and tmDC (p = 0.01) than KD subjects.
