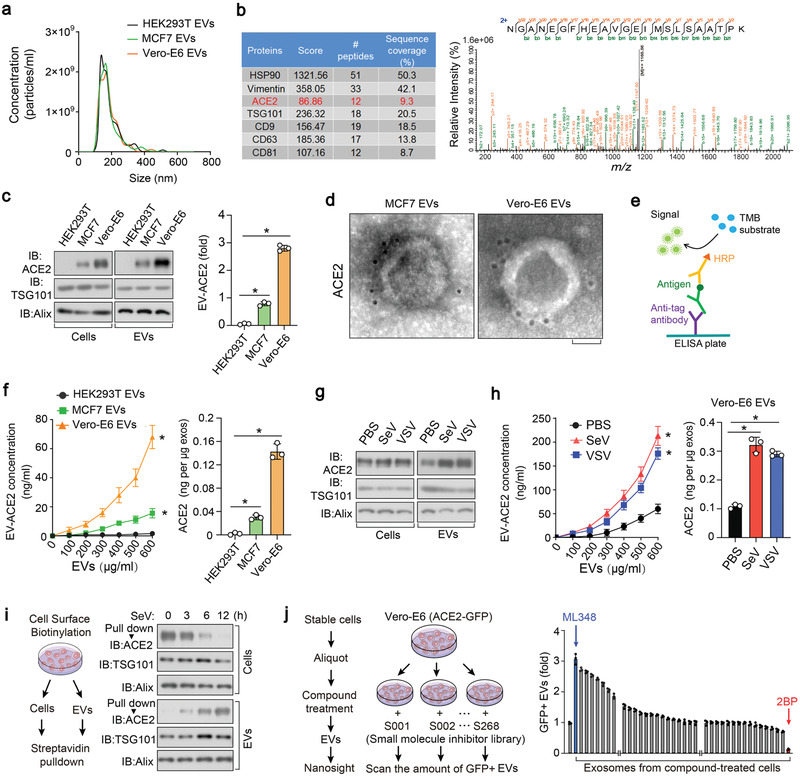
Figure 1.

Extrafacial expression of ACE2 on EVs and its regulation by protein palmitoylation. a) Nanoparticle tracking of purified EVs from HEK293T, MCF7, and Vero‐E6 cells. b) Mass‐Spectrometry (MS) analysis of purified EVs secreted by Vero‐E6 cells, showing results for HSP90, Vimentin, ACE2, TSG101, CD9, CD63, and CD81 (left), and the peptide of ACE2 identified in MS (right). c) Left panel: immunoblot (IB) analysis of ACE2 in whole cell lysate and purified EVs derived from HEK293T, MCF7; and Vero‐E6 cell lines; right panel: quantification of the ACE2 protein levels in the EVs of three independent experiments. d) TEM (transmission electron microscope) images of EVs derived from MCF7 and Vero‐E6 cell lines incubated with anti‐ACE2 antibodies and immune‐gold labeled by gold particles. Gold particles are depicted as black dots. Scale bar, 50 nm. e) Schematic diagram of ELISA to measure ACE2 concentration on the surface of EVs. TMB, tetramethylbenzidine; HRP, horseradish peroxidase. f) ELISA of ACE2 on the surface of EVs derived from HEK293T, MCF7, and Vero‐E6 cells assayed as (e) in various concentration. Quantification of ACE2 on the surface of three types of cells were shown right. g) IB analysis of ACE2 in whole cell lysate and EVs derived from Vero‐E6 cells treated with PBS, SeV, or VSV (MOI (multiplicity of infection), 0.1 for 24h. h) ELISA (left) and normalized quantification (right) of ACE2 on the surface of EVs derived from Vero‐E6 cells treated with control PBS, SeV, or VSV (MOI = 0.1) for 24 h. i) Schematic diagram of biotin‐labeling assay (left) and IB analysis (right) to measure ACE2 levels on the cell surface and in the secreted EVs from Vero‐E6 cells treated with SeV (MOI = 0.1) for the indicated times. j) Screening procedure for cellular components or pathways critical for the secretion of ACE2 into EVs (left); nanosight analysis of GFP positive EVs derived from Vero‐E6 cells expressing ACE2‐GFP and pre‐treated with small molecule inhibitor library (right). *p < 0.05 (two‐tailed Student's t test (c, right), (f, right), (h, right), and (j, (right) or two‐way ANOVA (f, left), (h, left)). Data are analyzed of three independent experiments and shown as means ± SD (c, right), (f, h, j, right).
