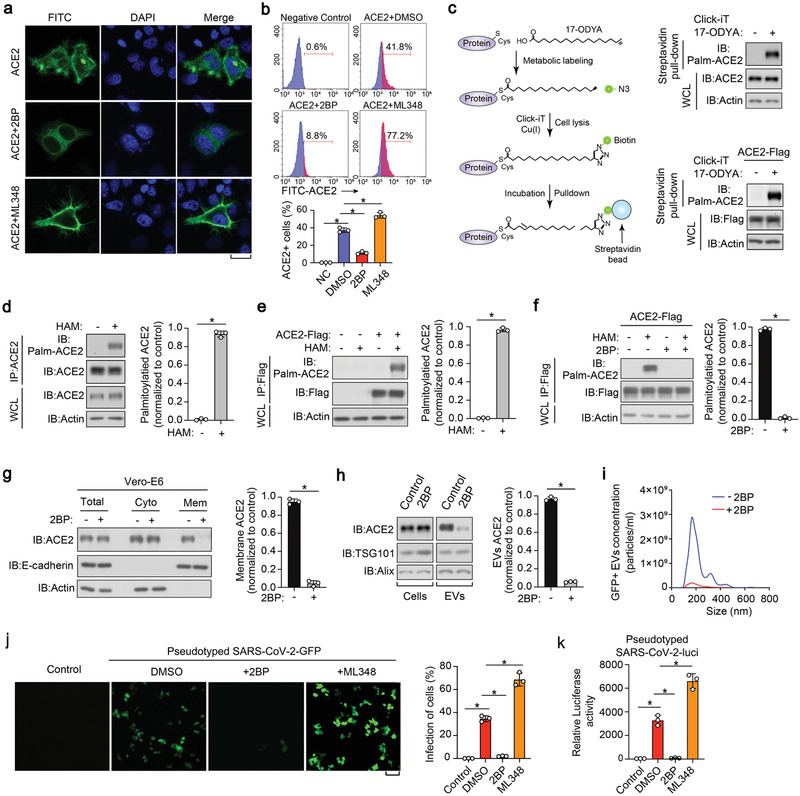
Figure 2.

S‐palmitoylation of ACE2 is required for its proper membrane targeting and secretion into EVs. a) Immunofluorescence and DAPI (4′,6‐diamidino‐2‐phenylindole) staining of HeLa cells transfected with ACE2‐Flag and treated with control DMSO, 2BP (50 µm) or ML348 (5 µm) for 24 h. Scale bar, 20 µm. b) FACS analysis (upper panel) and quantification (lower panel) of the percentage of ACE2 positive cells from HeLa cells transfected with ACE2‐Flag and treated with control DMSO, 2BP (50 µm) or ML348 (5 µm) for 24 h. c) Left panel: schematic diagram of Click‐iT reaction used for the detection of ACE2 palmitoylation. Cells were pre‐treated with 17‐ODYA; the lysates were reacted with biotin‐azide and then analyzed with Immunoblot (IB). Right panel: profile of palmitoylated ACE2 in Vero‐E6 cells (upper panel) and ACE2‐Flag‐expressed HEK293T (lower panel) incubated with 17‐OYDA (100 µm) for 6 h. d,e) IB analysis (left panel) and quantification (right panel) of S‐palmitoylation levels of ACE2 in Vero‐E6 (d) and HEK293T (e) cells transfected with ACE2‐Flag, followed by the lysis at the presence or absence of HAM (hydroxylamine, 1 m). f) IB (left panel) and quantification (right panel) of the S‐palmitoylation levels of ACE2 in HEK293T cells transfected with ACE2‐Flag and treated with 2BP (50 µµ, 24 h), followed by the lysis at the presence or absence of HAM (1 m). g) Left panel: IB of total, cytosolic, and membrane fractions of Vero‐E6 cells treated with or without 2BP (50 µm) for 24 h; right panel: quantification of membrane ACE2 of three independent experiments as left panel. h) Left panel: IB of total cell lysates and purified EVs derived from Vero‐E6 cells treated with or without 2BP (50 µm) for 24 h. Right panel: quantification of EV‐ACE2 of three independent experiments as in left panel. i) Nanosight analysis of GFP positive EVs derived from Vero‐E6 cells expressing ACE2‐GFP and treated with or without 2BP (50 µm) for 24 h. j) Representative images of HEK293T cells stably expressing ACE2 and pretreated with 2BP (50 µm) or ML348 (5 µm) for 24 h, followed by the infection with SARS‐CoV‐2‐GFP pseudovirus (MOI, 1) for 2 days. GFP positive cells from three different views were quantified and shown right. k) SARS‐CoV‐2‐luci pseudovirus (MOI, 1) were used to infect HEK293T cells stably expressing ACE2 and pretreated with 2BP (50 µm) or ML348 (5 µm) for 24 h. Luciferase activities in cell lysates were determined at 2 days post infection. *p < 0.05 (two‐tailed Student's t test. Data are analyzed from three independent experiments and shown as mean ± SD (d–h, right, j, right, k).
