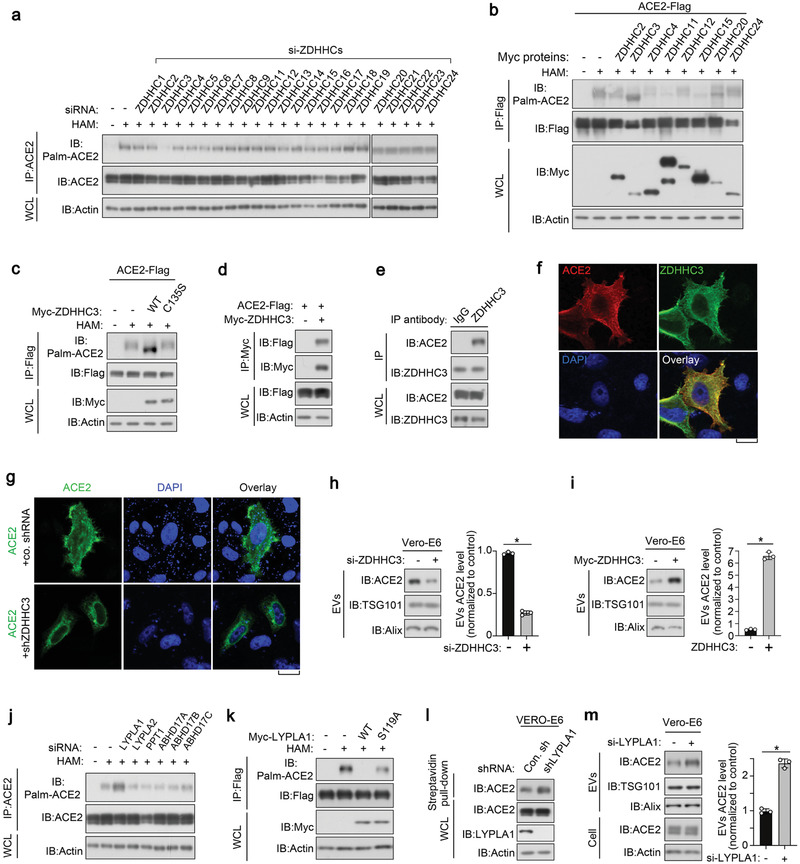
Figure 4.

ACE2 is palmitoylated by DHHC3 and depalmitoylated by LYPLA1. a) Immunoblot (IB) analysis of whole cell lysate (WCL) and anti‐ACE2 immunoprecipitants derived from HEK293T cells stably expressing ACE2 and transfected with si‐ZDHHCs as indicated. b) IB analysis of WCL and anti‐Flag immunoprecipitants derived from HEK293T cells transfected with c‐terminal Flag tagged ACE2 and Myc‐tagged ZDHHCs as indicated. c) IB analysis of WCL and anti‐Flag immunoprecipitants derived from HEK293T cells transfected with c‐terminal Flag‐taggedACE2, Myc‐tagged ZDHHC3‐WT, and C135S mutant. d) IB analysis of whole cell lysate (WCL) and anti‐Myc immunoprecipitant from HEK293T cells transfected with ACE2‐Flag and Myc‐ZDHHC3. e) IB analysis of WCL and anti‐ZDHHC3 immunoprecipitant from Vero‐E6 cells. f) Immunofluorescence and DAPI staining of HeLa cells transfected with ACE2‐Flag and Myc‐ZDHHC. Scale bar, 20 µm. g) Immunofluorescence and DAPI staining of control and ZDHHC3 stably depleted Vero‐E6 cells transfected with ACE2. h) IB analysis of EVs from Vero‐E6 cells transfected with control siRNA or si‐ZDHHC3. ACE2 expression in EVs was quantified of three independent experiments and shown right. i) IB of EVs purified from Vero‐E6 cells transfected with or without Myc‐ZDHHC3 as indicated. EV‐ACE2 was quantified of three independent experiments and presented shown right. j) IB analysis of WCL and anti‐ACE2 immunoprecipitants derived from HEK293T cells transfected with si‐depalmitoylases as indicated. k) IB analysis of WCL and anti‐Flag immunoprecipitants derived from HEK293T cells transfected with expression plasmids encoding ACE2‐Flag, Myc‐LYPLA1‐WT, and S119A mutant. l) IB analysis of WCL and streptavidin pull‐down derived from Vero‐E6 cells infected with lentivirus encoding control shRNA (Con.sh) or LYPLA1 shRNA. m) IB analysis of ACE2 in both cells and EVs derived from Vero‐E6 cells transfected with control siRNA or si‐LYPLA1. EV‐ACE2 was quantified of three independent experiments and shown right. *p < 0.05 (two‐tailed Student's t test (h, right, i, right, m, right). Data are analyzed of three independent experiments and shown as mean ± SD (h, right, i, right, m, right).
