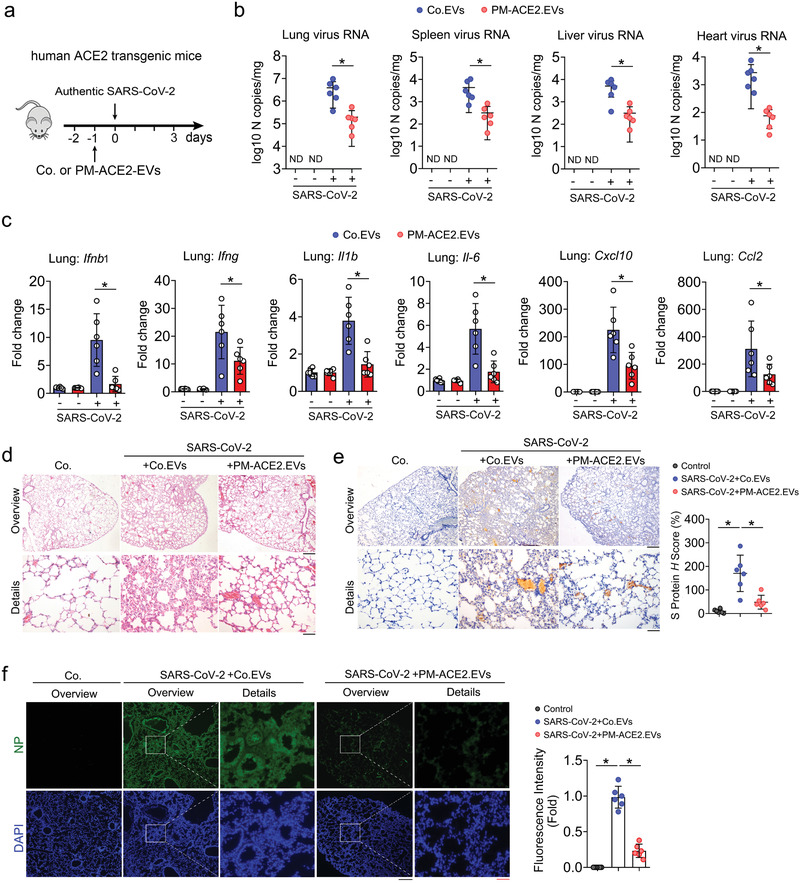
Figure 8.

PM‐ACE2‐EVs display strong ability to enrich and neutralize authentic SARS‐CoV‐2. a) Neutralization of Con. EVs or PM‐ACE2‐EVs to authentic SARS‐CoV‐2 in hACE2 transgenic mice: six‐week‐old hACE2 transgenic mice were tail vein‐injected with Con. EVs or PM‐ACE2‐EVs (100 µg per day) at day ‐1, followed by intranasal inoculation of authentic SARS‐CoV‐2 (106 TCID50/50 µl) at the day 0. n = 6 for each group. b) Authentic SARS‐CoV‐2 burden at 3 dpi was determined in the lung, spleen, heart, and liver by RT‐qPCR. c) Relative fold changes in gene expression of cytokines and chemokines were calculated by qRT‐PCR in lung homogenates at 3 dpi from Con. EVs or PM‐ACE2‐EVs‐treated mice. n = 6 for each group. d) Hematoxylin and eosin staining analysis of tissue injury in lung sections from hACE2 transgenic mice pre‐treated with PBS, Con. EVs (100 µg per day), or PM‐ACE2‐EVs (100 µg per day) for one day and then intranasally inoculated with authentic SARS‐CoV‐2 (106 TCID50/50 µl). Scale bar, 500 µm (top) or 100 µm (bottom). e) Left panel: immunohistochemistry assay of the SARS‐CoV‐2 S protein antigen (brown) of lung sections from ACE2 transgenic mice as in (d). Scale bar, 500 µm (top) or 100 µm (bottom). Right panel: H score quantification of the S protein expressions. f) Left panel: representative immunofluorescence and DAPI staining of lung tissue from hACE2 mice as in (d). Scale bar, 500 µm (top, middle) or 100 µm (bottom). Right panel: fluorescence intensity quantification of the S protein expressions. *p < 0.05 (two‐tailed Student's t test (b,c,e, right; f, right). Data are representative of at least two independents with triplicates and shown as mean ± SD (b, c, e, right; f, right).
