
Figure 1.
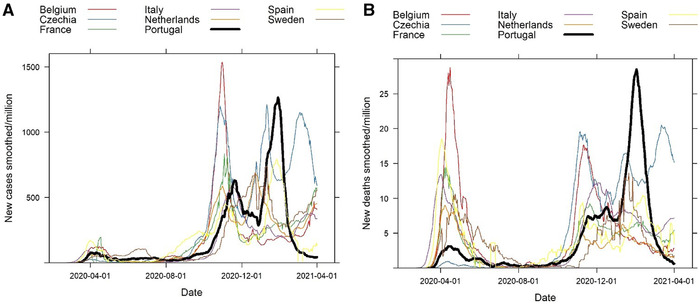
Comparison of the evolution of the COVID‐19 pandemic in Portugal and other selected European countries. Overview regarding SARS‐CoV‐2 infections for counties indicated, obtained from March 1, 2020 to April 1, 2021. (A) Number of new cases per million and (B) number of new deaths per million. These figures demonstrate the severity of the large third wave of cases in January in Portugal (black line) when compared with other select neighboring countries (Spain, France, Italy) and other countries of similar population size (Belgium, Czechia, Netherlands, and Sweden). Data from “Our World in Data” (https://ourworldindata.org/coronavirus).