
FIGURE 3.
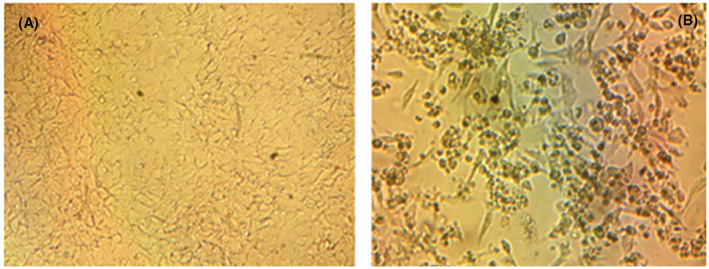
Cytopathological effects of the SARS‐CoV‐2 in Vero E6 cells compared to the control group. A, Control group, (B) cytopathological changes caused by SARS‐CoV‐2. A, Image of Vero cells at the end of the 96th hours of incubation (RPMI‐1640 medium contained 1% fetal calf serum). B, Picture of Vero cells infected with SARS CoV‐2 at the end of 96th hours of incubation (RPMI‐1640 medium contained 100 TCID50 virus and 1% fetal calf serum). A, B, Under of inverted microscope at 100‐fold magnification. SARA‐CoV‐2, severe acute respiratory syndrome coronavirus 2