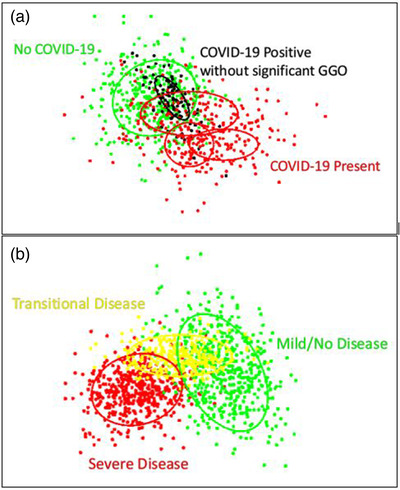
FIGURE 3.

(a) Example of embeddings for a diagnosis task. Red points show positive embeddings, while green and black points show negative embeddings. The ovals depict distributions estimated from the points, with the different ovals referencing different presentations of disease. For example, presentations of COVID‐19 on CT images include ground glass opacities, crazy paving, and architectural distortions. The black oval indicates a positive presentation that significantly overlaps with the negative class distribution, indicating that these cases are problematic and may need a larger prevalence in the training set. (b) Example of embeddings for prognostic clinical evaluation. Green, yellow, and red points refer to healthy/mild, intermediate, and severe disease stages with corresponding distributions depicted through ovals. Clinically, this could be used to help identify in which stage a patient lies and appropriately guide clinical decisions
