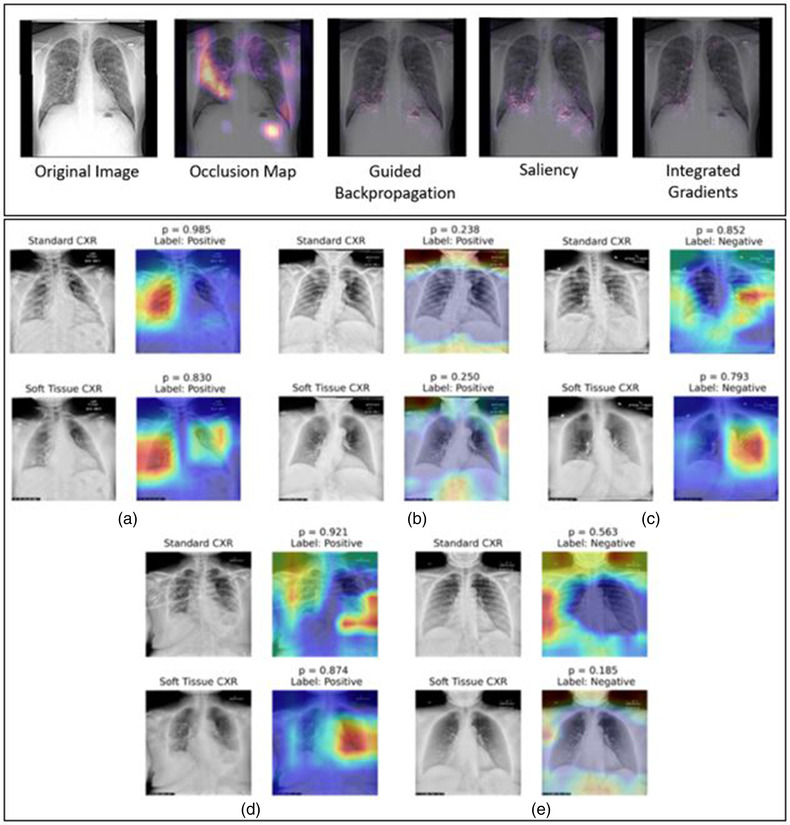
FIGURE 4.

Example heatmaps obtained from a variety of techniques (top) 70 and from Grad‐CAM (bottom). 67 Each technique may provide different evaluations of influential regions, both in terms of relative importance and key locations. Further, note that Grad‐CAM may identify regions that are not important to a human observer. Regions outside the lungs were identified with relatively high influence for the network classification even though a radiologist likely would not use this information in COVID‐19 diagnosis. In the examples by Hu (bottom), some of the Grad‐CAM examples demonstrate reasonable heatmap localization (a–c), while others are less intuitive (d, e). Acquired with permission
