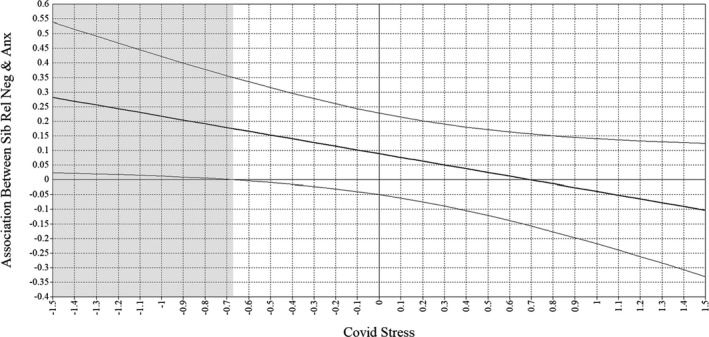
Figure 4.

Johnson‐Neyman plot of the interaction between sibling relationship negativity × covid stress on anxiety symptoms.
Note. All variables standardized. Thick black line represents association between sibling relationship negativity and anxiety; light black lines represent the upper and lower bounds of a 95% CI around this association. Region within the gray rectangle depicts values of Covid Stress at which the association between sibling relationship negativity and anxiety is significantly positive. Sib Rel Neg, Sibling Relationship Negativity.
