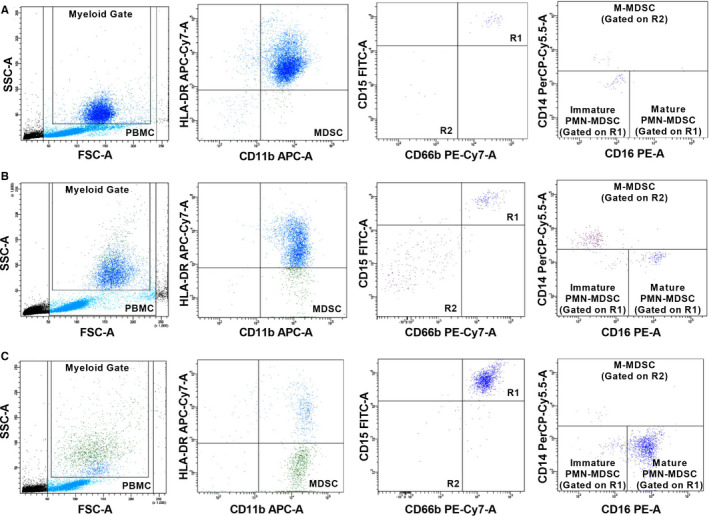
FIGURE 2.

Flow cytometric analysis of MDSCs from (a) a control, (b) a patient in the mild subgroup and (c) a patient in the severe subgroup. Total MDSCs were identified as HLA‐DR‐CD11b+ on the myeloid gate. PMN‐MDSCs were determined as CD15+CD66b+ population (R1 gate) and classified as CD16+ mature and immature PMN‐MDSCs. M‐MDSCs were determined as CD14+ population in the CD15‐CD66b‐ population (R2 gate). M‐MDSCs, monocytic myeloid‐derived suppressor cells; MDSCs, Myeloid‐derived suppressor cells; PMN‐MDSCs, polymorphonuclear myeloid‐derived suppressor cells
